
Free ER Diagram Tool 2026: Top Open Source Picks
In the high-stakes world of software development and data architecture, building a complex system without a blueprint is a recipe for disaster. Imagine trying to construct a skyscraper without calculating the load-bearing walls—it might stand for a moment, but it will eventually crumble under its own weight. In the digital realm, that blueprint is the Entity Relationship Diagram (ERD).
Whether you are a computer science student learning database theory or a senior architect designing a microservices infrastructure, mastering the ERD is non-negotiable. However, the way we create, share, and maintain these diagrams is often fundamentally broken. We are stuck in a cycle of switching between isolated drawing tools and static text editors, creating a "documentation gap" where our diagrams rarely match our code.
In this comprehensive guide, we will explore the core concepts of ERDs, analyze the market to help you find the best entity relationship diagram tool for your specific needs, and demonstrate how next-generation open-source solutions are merging diagrams and documentation into a single, living workflow.
What is an Entity Relationship Diagram?
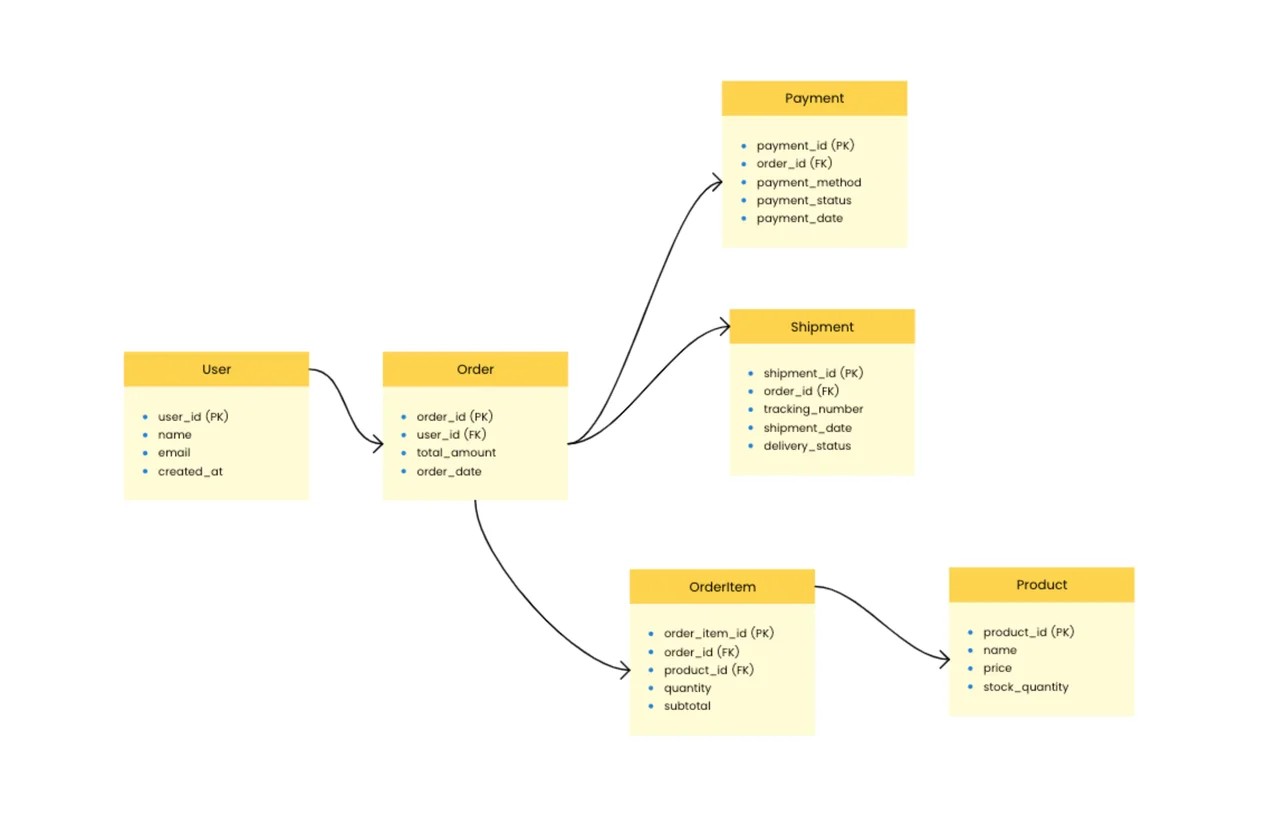
At its core, an entity relationship diagram (ER diagram or ERD) is a flowchart that illustrates how "entities" such as people, objects, or concepts relate to each other within a system. It is the visual representation of a data structure.
ERDs are most commonly used in database design to visualize the logic behind a relational database. However, according to TechTarget’s definition of Data Modeling, these diagrams are also critical in business analysis for mapping out system requirements and clarifying business rules before a single line of code is written.
The Three Pillars of ERD
To create a valid entity relationship diagram example, you need to understand its three main components:
- Entities (The "Nouns"): Represented by rectangles, entities are the objects or concepts for which you want to store data.
Example: Customer, Product, Order.
- Attributes (The "Adjectives"): Represented by ovals (or listed inside the entity rectangle in modern notation), these are the specific details of an entity.
Example: A Customer entity has attributes like UserID, Email, and PhoneNumber.
- Relationships (The "Verbs"): Represented by diamond shapes or connecting lines, these describe how entities interact.
Example: A Customer places an Order.
Understanding Cardinality
The true power of an ERD lies in defining Cardinality—the numerical nature of the relationship. When you look for entity relationship diagram symbols, you will often see "Crow’s Foot Notation."
-
One-to-One (1:1): One entity is associated with exactly one other entity. (e.g., A Person has one Social Security Number).
-
One-to-Many (1:N): One entity is associated with multiple others. (e.g., A User can publish many Blog Posts).
-
Many-to-Many (M:N): Multiple records in a table are associated with multiple records in another table. (e.g., Students and Classes).
Pro Tip: For complex systems, you may need an Enhanced Entity Relationship Diagram (EERD), which includes advanced concepts like generalization and specialization (subclasses and superclasses).
For a deeper dive into the academic theory of data modeling, the IBM Cloud Learn Hub offers an excellent breakdown of conceptual vs. physical data models.
What Makes an ERD Tool "The Best"? (Selection Criteria)
Before downloading the first software you see on Google, consider what your specific workflow demands. Choosing the right ERD design tool depends on your role. The "best" tool for a solo student is different from the best tool for a DevOps team. Here are the critical factors to evaluate:
- Standard Support (Crow's Foot vs. Chen):
Does the tool support industry-standard notations? While creative tools like Canva allow you to draw boxes, they lack the specific entity relationship diagram symbols (like the three-pronged "crow's foot" for 1:N relationships) that developers strictly require.
- Code Generation vs. Conceptual Design:
Are you looking to auto-generate SQL code from your diagram? Tools like MySQL Workbench excel here but are clunky for brainstorming. If you need to visualize business logic first, a whiteboard-style tool is superior.
- The "Freemium" Trap:
Many tools advertise as a free entity relationship diagram tool, but hit you with a paywall after you draw 3 diagrams or use 50 shapes. Always check if the "Free" version is actually usable for a full project or just a trial.
Pro Tip: Open-source solutions (like AFFiNE) typically offer fewer restrictions than SaaS freemium models.
- Documentation Integration:
This is the most overlooked feature. A diagram without context is just a drawing. The best tools allow you to annotate your models with rich text descriptions directly on the canvas, preventing the need to switch apps.
Best Entity Relationship Diagram Tool
If you search for the best entity relationship diagram tool, you will be overwhelmed by the options. From legacy desktop software to lightweight web apps, the market is saturated. However, not all tools are created equal. The "best" tool depends entirely on your role: are you a pure database administrator, a collaborative product manager, or a full-stack developer?
Here is a detailed breakdown of the leading competitors, their pros and cons, and where they fall short compared to the next-generation workflow offered by AFFiNE.
1. Lucidchart & Draw.io (The Industry Standards)
Target Audience: General business users and system analysts. Overview: These are the heavyweights of general-purpose diagramming. While Lucidchart is the polished enterprise standard, Draw.io (diagrams.net) is the popular open-source alternative.
Pros:
-
Lucidchart: Extremely polished UI with extensive template libraries.
-
Draw.io: Completely Open Source and free, making it a favorite for developers who want offline XML file control without a subscription.
-
Integration: Both offer solid integrations with Google Drive and Atlassian suites.
Cons:
-
The "Silo" Problem: Whether open-source or paid, these are strictly ER diagram drawing tools, not database architects. Your diagram lives in a separate tab from your documentation. You have to export images to put them in your PRD (Product Requirement Document).
-
Context Gap: You cannot write detailed API specs inside the diagram easily; text handling is limited to labels.
-
Cost (Lucidchart): Advanced features in Lucidchart require expensive monthly subscriptions.
2. Dbdiagram.io (The Developer’s Choice)
Target Audience: Backend engineers and DBAs.
Overview: This tool uses a domain-specific language (DBML) to generate diagrams from code.
Pros:
-
Speed: fast for developers who prefer typing over dragging shapes.
-
Schema Import: Easily import SQL to generate a visual.
Cons:
-
High Learning Curve: Non-technical stakeholders (PMs, Clients) cannot easily edit the diagram.
-
No Documentation Layer: It is strictly for schema visualization. You cannot add rich text, images, or business context around the tables.
3. Miro / Mural (The Whiteboard Giants)
Target Audience: Agile teams and brainstormers.
Overview: These are infinite canvas tools designed for collaboration and workshops.
Pros:
-
Excellent for real-time multiplayer collaboration.
-
Great for high-level "messy" brainstorming sessions.
Cons:
-
Lack of Precision: They are not specialized entity relationship diagram software. Connecting lines often don't "snap" intelligently like in specialized tools, making complex schemas look messy.
-
Symbol Limitations: They often lack specific Crow’s Foot notations or database-specific attribute lists out of the box.
4. AFFiNE (The All-in-One Architecture Platform)
Target Audience: Software Architects, Full-Stack Developers, and Product Teams.
Overview: AFFiNE is an open-source knowledge base that combines a whiteboard and a document editor. It represents the "Next Gen" of tooling.
Why it stands out:
-
Contextual Depth: Unlike Lucidchart, AFFiNE allows you to utilize Edgeless Mode to draw the ERD and Page Mode to write the technical specifications for that ERD on the exact same surface.
-
Local-First & Open Source: Data privacy is critical for database designs. AFFiNE allows you to keep data local, unlike cloud-only tools.
-
Cost-Effective: It serves as a free entity relationship diagram tool for individuals and offers powerful features without the enterprise markup of legacy software.
Verdict: If you just need a quick sketch, a whiteboard tool is fine. If you are a DBA needing SQL generation, code-based tools work. But if you are looking for the best entity relationship diagram tool to manage the entire lifecycle of a project—from visual design to technical documentation—AFFiNE is the superior choice.
Comparing Top ERD Tools for 2026
| Feature / Capability | AFFiNE | Miro / Mural | Lucidchart / Draw.io | Dbdiagram.io |
|---|---|---|---|---|
| Primary Focus | Visuals + Documentation (All-in-One) | Brainstorming & Whiteboarding | Pure Diagramming & Visualization | Database Schema as Code (DBML) |
| Open Source | ✅ Yes | ❌ No | Lucidchart: ❌ NoDraw.io: ✅ Yes | ❌ No |
| Drawing Experience | ✅ Professional (Vector-based, Edgeless Mode) | Freehand (Lacks strict ERD snapping) | ✅ Professional (Drag & drop, standardized shapes) | Code-only (Auto-generated) |
| Tech Specs Integration | ✅ Native (Write full API docs next to diagrams) | Unstructured (Sticky notes) | ❌ Disconnected (Requires external doc tools) | ❌ Minimal (Comments in code only) |
| Data Privacy | 🔒 Local-First & Open Source (Own your data) | Cloud-Only | Cloud-Only (SaaS) | Cloud-Only |
| Collaboration | Real-time (Collaborative Workspace) | Real-time (Excellent) | Real-time (Paid tiers) | Real-time (Limited) |
| Offline Access | ✅ Yes (Full support on Mac/Windows apps) | ❌ No | ❌ No | ❌ No |
| Cost Model | Free / Open Source (Free for individuals) | Subscription (Pay-per-seat) | Subscription (Pay-per-user) | Freemium (Limits on diagrams) |
| Best Used For... | End-to-end Architecture & Dev Documentation | High-level team brainstorming sessions | Formal presentations & strict business processes | Quick schema prototyping for DBAs |
The Next-Gen Solution: Integrated Workflows
The separation of visual model and technical documentation is the primary bottleneck in modern software engineering. We call this "Context Switching," and it kills productivity.
AFFiNE solves this by offering a "Canvas + Doc" architecture.
Why AFFiNE for Database Design?
-
Edgeless Mode (The Whiteboard): Switch to AFFiNE's Whiteboard mode to draw complex ER diagrams using professional shapes and connectors. It supports the infinite canvas approach, allowing your diagram to grow as your database scales.
-
Page Mode (The Document): With a single click, the same content frame can be viewed as a structured document. This is perfect for writing the API definitions that correspond to your ERD. You can read more about this dual-view capability in the AFFiNE Docs.
-
Local-First & Open Source: For developers concerned about data privacy, AFFiNE is local-first. You own your data. Plus, you can inspect the code on GitHub or contribute to the ecosystem.
Stop switching tabs. In AFFiNE, your database schema (ERD) lives on the left, and your API documentation lives on the right. It’s the end of disconnected workflows.
Building an ERD Workflow in AFFiNE
Let’s walk through how to create an entity relationship diagram that stays relevant using AFFiNE. We will simulate designing a "Blog System."
Step 1: Research and Gathering Requirements
Before drawing, you need to know what you are building. Use the AFFiNE Web Clipper to capture articles, StackOverflow threads, or competitor API docs directly into your workspace. This ensures all your reference material is on the same page as your design.
Step 2: Use a Professional Template
Don't start from scratch. Navigate to the AFFiNE Template Gallery and select the Entity Relationship Diagram (ERD) Template. This template comes pre-loaded with the standard notations you need, saving you time on setup.
Step 3: Draw the High-Level Model (The Whiteboard Phase)
Enter Edgeless Mode. Drag out your entities: User, Post, Comment, Category. Use connectors to establish relationships. Draw a line from User to Post and add the text "1:N" (One User, Many Posts). Because AFFiNE uses a vector-based drawing engine (powered by BlockSuite), the lines snap perfectly to the shapes.
Step 4: Add Technical Specifications (The Doc Phase)
Here is the magic. In traditional tools, you would stop here. In AFFiNE, you double-click next to the User table and start typing. You can create a detailed table defining the fields:
-
id: UUID, Primary Key.
-
email: Varchar(255), Unique, Indexed.
-
created_at: Timestamp.
You can even insert a Cornell Notes Template right next to the diagram to document design decisions or open questions for the team.
Step 5: Leverage AI for Optimization
Stuck on a relationship? Use AFFiNE AI. You can ask the AI helper: "What are the standard attributes for an E-commerce Order table?" This turns your diagramming tool into an intelligent coding partner.
In 2026, you don't just draw schemas; you generate them. AFFiNE AI can read your text-based product requirements and auto-suggest the necessary database entities, saving you hours of manual mapping.
Beyond Just Drawing (Advanced Workflows)
AFFiNE isn't just an entity relationship diagram software free of charge; it is a project management powerhouse.
1. From Design to Tasks
Convert your ERD entities into tasks. If you have a User table, create a Kanban board using the Kanban Template right below the diagram to track the implementation status (e.g., "Create Migration," "Build Model," "Write Tests").
2. Activity and Flow Diagrams
Databases don't live in a vacuum. You often need to visualize how data flows. You can use the Data Flow Diagram Template or the Activity Diagram Template on the same canvas to show how an API request transforms into a database query.
Frequently Asked Questions (FAQ)
To help you navigate the world of database design, here are answers to the most common questions we hear from developers and architects.
Q1: Is there a truly free entity relationship diagram tool?
Yes. While many tools offer limited "freemium" versions that restrict the number of shapes or diagrams, AFFiNE offers a robust open-source version that is free for personal use. It allows unlimited blocks and local storage, making it a powerful free entity relationship diagram drawing tool without the paywalls found in SaaS competitors.
Q2: What is the difference between ERD and EERD?
An ERD (Entity Relationship Diagram) represents the basic structure of entities and relationships. An EERD (Enhanced Entity Relationship Diagram) adds complexity by including concepts like Superclasses and Subclasses (Inheritance), Generalization, and Aggregation. EERDs are used for more complex database designs. You can draw both types in AFFiNE using its flexible shape library.
Q3: Can I draw an ER diagram online without downloading software?
Absolutely. AFFiNE has a web version that works directly in your browser, as do tools like Draw.io. However, for better performance and offline access, downloading the AFFiNE Client for Mac & Windows is recommended.
Q4: How does an ERD help with API design?
An ERD defines the underlying data structure. When designing a REST or GraphQL API, the "Resources" usually map directly to the "Entities" in your diagram. By using AFFiNE, you can place your ER diagram on the left and write your JSON response schemas on the right, ensuring your API matches your database reality.
Q5: What are the standard symbols used in ER Diagrams?
The most common standard is Crow’s Foot Notation, widely used in engineering.
-
Rectangle: Entity.
-
Diamond: Relationship (in Chen notation) or a labeled line (in Crow's Foot).
-
Oval: Attribute. For a detailed guide on these standards, Atlassian’s Guide to Architecture Diagrams is a great external resource.
Q6: Can I collaborate on an ERD in real-time?
Yes. Modern tools like AFFiNE support real-time multiplayer editing, allowing developers and PMs to whiteboard database schemas together on the same canvas.
Conclusion: Stop Context Switching
The era of fragmented development tools is ending. You shouldn't have to pay for a diagramming tool, a documentation tool, and a project management tool just to design a database.
Creating an entity relationship diagram should be a fluid part of your engineering workflow, not a chore. By using AFFiNE, you empower yourself to:
-
Draw complex schemas with professional ERD templates.
-
Document technical logic in the same view.
-
Collaborate with your team in real-time.
Ready to upgrade your workflow?
-
Download AFFiNE for Mac & Windows or iOS & Android.
-
Join the AFFiNE Community to share your diagrams.
-
Star the project on GitHub to support open-source development.
Don't let your database documentation rot. Start drawing and writing together today.