Gap Analysis Template: A 4-Step Guide With a Worked Example
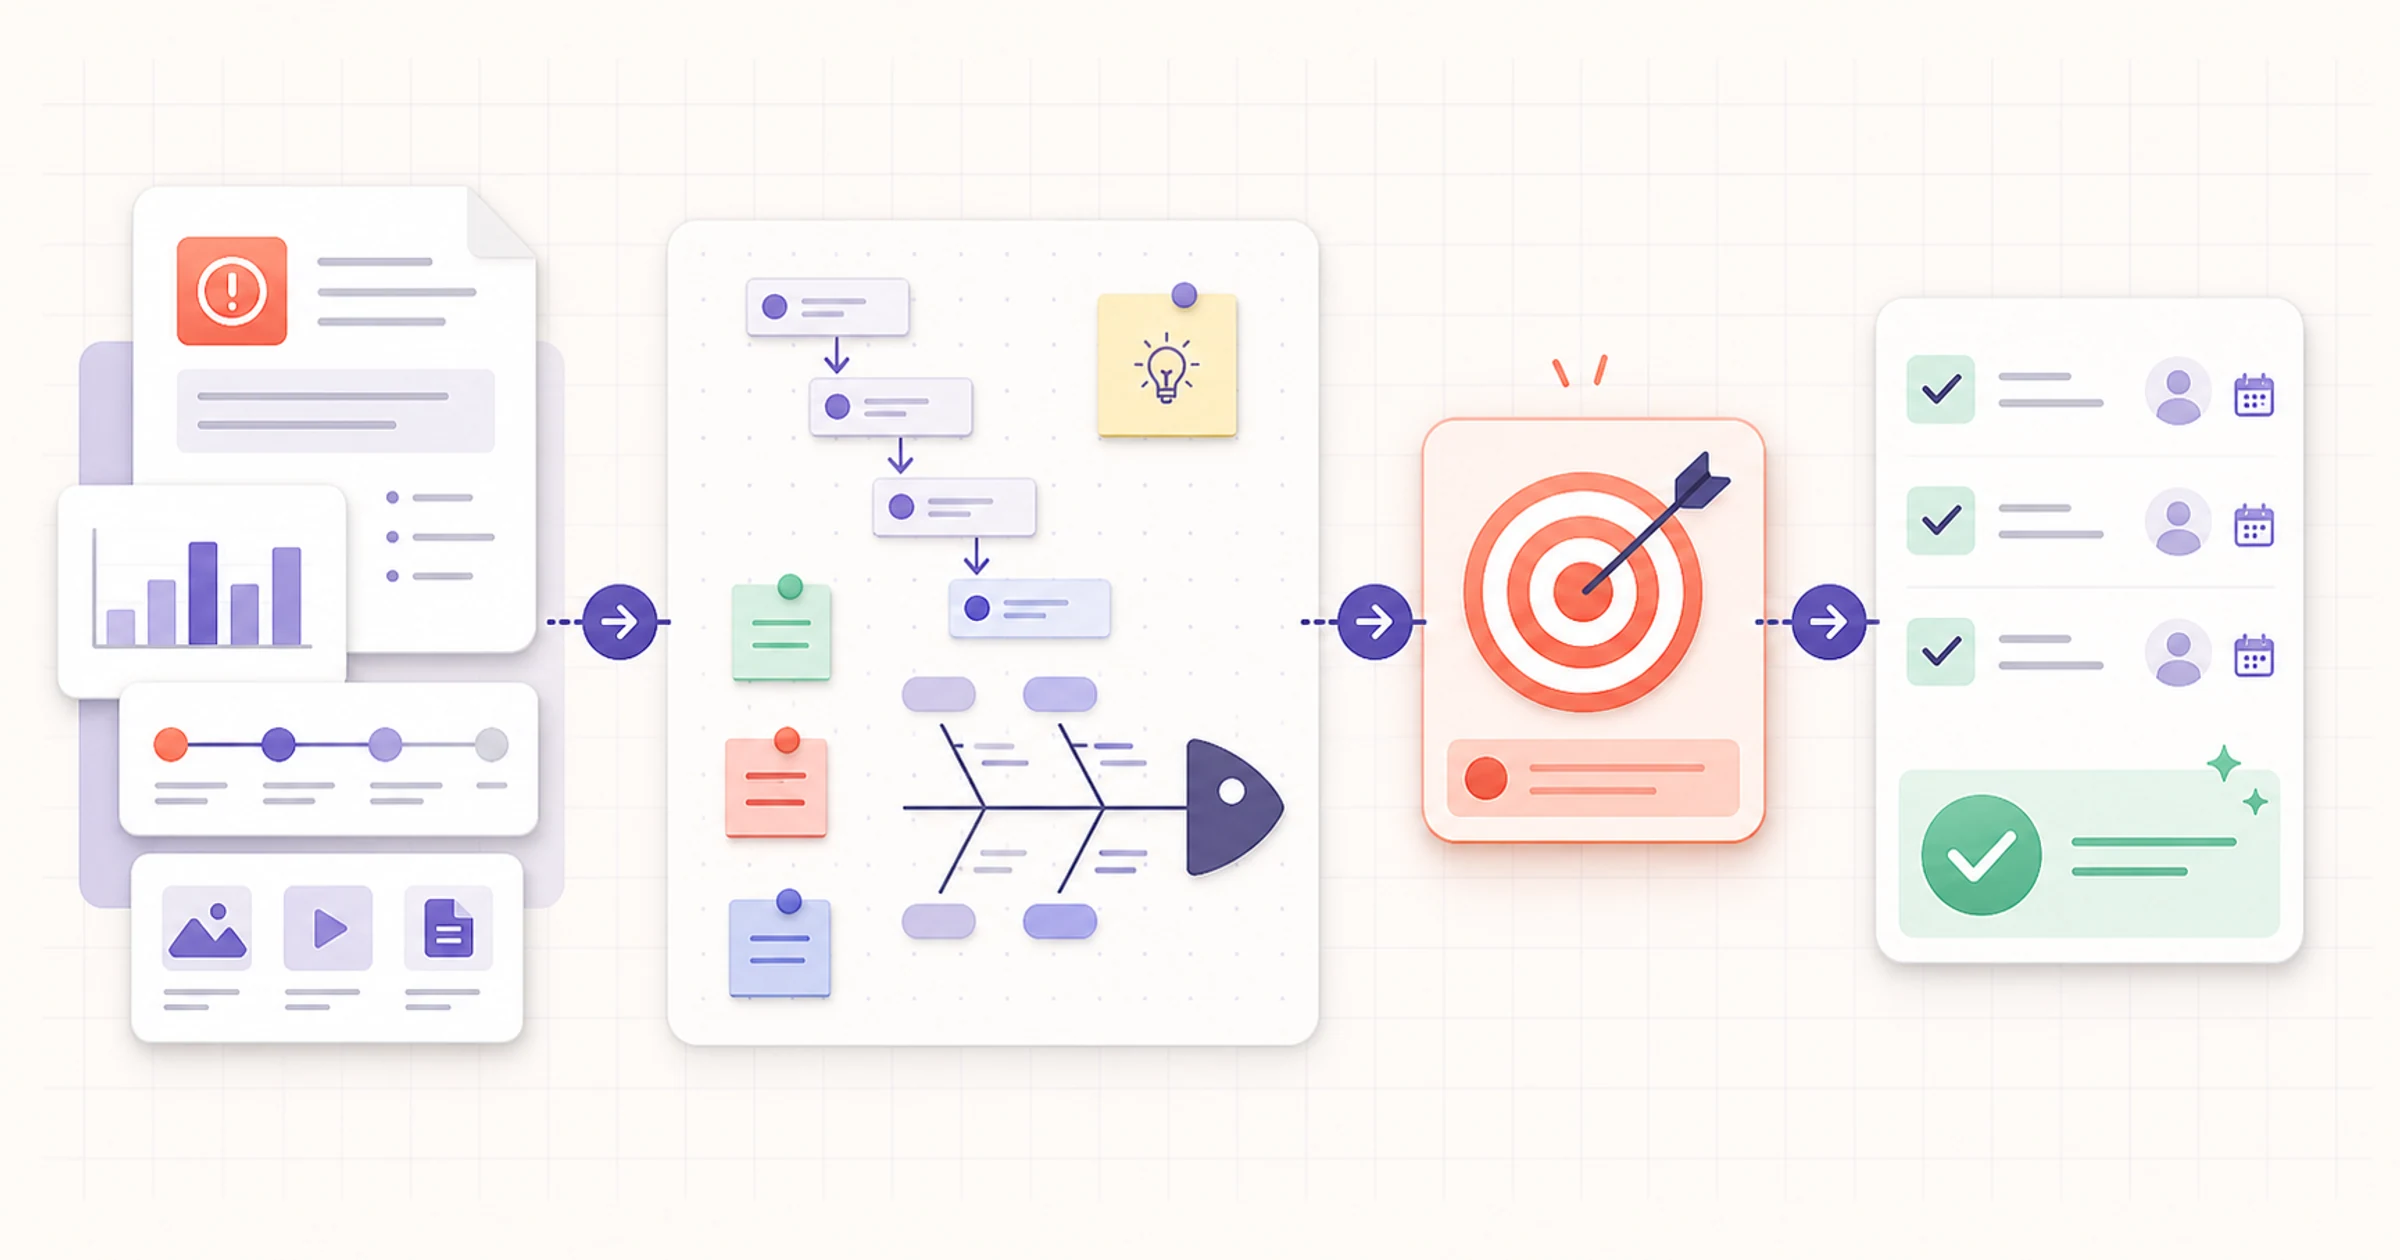
A gap analysis template is a structured way to compare a current state with a defined target state, record the evidence behind both, and turn the difference into owned actions. Use it when a team agrees on the outcome it wants but needs a traceable answer to three questions: Where are we now, where do we need to be, and what should we change first?
The American Society for Quality glossary describes gap analysis as comparing a present condition with a desired future condition. A useful template goes further by recording comparable measures, assumptions, impact, effort, ownership, and a review date. That prevents a list of problems from masquerading as a plan.
Definition: A gap analysis template is a reusable table that connects current-state evidence, a measurable target, the difference between them, and prioritized next actions. It supports planning; it does not prove why the gap exists or guarantee that a proposed action will close it.
This guide is practical and tool-neutral. Its SaaS onboarding example is fictional, with disclosed numbers that let you reproduce the logic rather than trust a case-study claim.
Gap analysis template: copy and adapt
Copy this table into a shared document or spreadsheet. Use one row per meaningful gap, not one row per complaint. If two rows have different owners, evidence, or target dates, they are probably separate gaps.
| Scope or outcome | Owner | Evidence source | Current state | Target state | Gap | Impact | Effort | Priority | Next action | Review date |
|---|---|---|---|---|---|---|---|---|---|---|
| What result is in scope? | Who maintains this row? | Where can a reviewer verify it? | Baseline, period, and unit | Desired value, date, and rationale | Comparable difference | 1-5 with reason | 1-5 with reason | Rule plus judgment | Specific verb and deliverable | When will evidence be reviewed? |
| Example: 14-day activation | Product ops | Cohort report, Apr–Jun | 46% of eligible accounts | 65% by Q4 | 19 percentage points | 5: core adoption outcome | 3: several workflow changes | High, pending cause validation | Analyze setup drop-off by step | September 15 |
The owner maintains the analysis; that person does not have to perform every action. The evidence source should be precise enough that another reviewer can locate the underlying record. “Dashboard” is weaker than a named report, cohort definition, and date range.
Write percentage gaps as percentage points when subtracting two percentages. A move from 46% to 65% is a 19-percentage-point gap. It is also about a 41% relative increase from the current value, but mixing those expressions without labeling them invites confusion.
Use qualitative categories when a numeric scale would create false precision. For example, a policy-readiness gap can be recorded as “drafted, not reviewed, not approved” rather than forcing it into an unsupported 63% score.

When should you use a gap analysis?
A gap analysis works best when the target is meaningful and the current condition can be observed. Common applications include:
- Performance: compare a service level, cycle time, quality measure, or conversion outcome with a defined target.
- Process: document missing controls, unclear handoffs, duplicated work, or capacity constraints.
- Capability or skills: compare required work with demonstrated capabilities rather than job titles.
- Fit: assess where a tool meets, partially meets, or misses documented requirements.
- Readiness and strategy: show what remains before a launch or future operating model is credible.
Do not start with gap analysis when nobody can define the target state. In that situation, discovery, user research, or strategy work comes first. Do not use a gap table to assert causation, either. If activation is below target, the difference tells you what is short; it does not establish why. Use evidence and, when the cause matters, a root cause analysis or an experiment before committing to a costly remedy.
How to do a gap analysis in four steps
1. Define a bounded scope and target
Write one outcome, population, process boundary, and decision. “Improve onboarding” is too broad. “Increase 14-day activation for eligible self-serve accounts created in Q4” is reviewable.
Then define the target value, target date, and rationale. A target might come from a contractual requirement, a policy, an approved operating plan, a customer need, or a tested internal benchmark. Label the basis. Do not present a competitor's number as automatically appropriate for your product or population.
Ask four questions before continuing:
- What decision will this analysis support?
- Which people, process steps, products, or periods are in scope?
- What is explicitly out of scope?
- Who can approve the target and who maintains the evidence?
If stakeholders disagree about the destination, preserve that disagreement. A neat future-state column does not create alignment by itself.
2. Document comparable current and target states
Collect the smallest responsible baseline. Record the source, period, unit, population, definition, and known limitations. Use the same definitions on both sides.
For a process gap, combine outcome data with current handoffs. For a capability gap, describe observable work and proficiency criteria. For a fit gap analysis template, trace each requirement to a demonstration, test, contract, or technical review.
Separate facts, estimates, and assumptions. A fact may be “58% of eligible accounts completed setup in the selected cohort.” An estimate may be “the new checklist requires two engineering weeks.” An assumption may be “setup completion is a leading indicator of activation.” Each can support planning, but they should not receive the same confidence.
3. Quantify or categorize each gap
Use arithmetic only when the values are comparable:
Absolute gap = target value - current value
Relative increase required = (target value - current value) / current value
For a cycle-time measure where lower is better, state the direction: reducing a median from 3.8 days to 2.0 days requires a 1.8-day reduction. For a maturity or readiness state, use defined categories such as absent, drafted, tested, approved, and operating. Include evidence for the category selected.
The ASQ article “Gap Analysis: The Sow's Ear” treats gap analysis as a way to compare actual performance with potential or desired performance. The calculation makes that comparison visible; it still does not diagnose a mechanism.
4. Prioritize actions, ownership, and review
Do not sort only by gap size. A large gap may have low impact, weak evidence, a hard dependency, or no feasible intervention. For each candidate action, record:
- expected impact and the reason for the rating;
- confidence in the evidence or causal assumption;
- effort, cost, and lead time;
- dependencies and possible side effects;
- one accountable owner;
- the next deliverable and review date.
A simple score can make assumptions discussable. For example:
Planning priority = (impact × confidence) / effort
Define every scale before scoring. The score is a conversation aid, not a law. Keep regulatory obligations, safety, reversibility, strategic fit, and dependencies visible even when they do not fit the formula. Convert the selected work into an action plan with owners and due dates.

Worked gap analysis example: SaaS onboarding
This fictional example shows the method, not an AFFiNE result or a customer case study. Assume a product team reviews eligible self-serve accounts created from April through June. It uses consistent event definitions and excludes test, internal, and refunded accounts.
Current state vs. future state
| Measure | Current state | Target state | Calculated gap | Evidence and limitation |
|---|---|---|---|---|
| 14-day activation | 46% | 65% | 19 percentage points | Cohort report; activation-event definition was unchanged during the period |
| Median time to first value | 3.8 days | 2.0 days | 1.8-day reduction | Event timestamps; median hides variation among account types |
| Setup completion | 58% | 80% | 22 percentage points | Setup funnel; completion may correlate with activation but does not prove causation |
The target values are planning assumptions approved for this fictional exercise. They are not industry benchmarks. Before copying them, a real team would examine segmentation, data quality, customer value, commercial constraints, and whether the targets create undesirable behavior.
Candidate actions and disclosed scoring
The team defines three 1-5 scales:
- Impact: 1 means a small expected contribution to the scoped outcome; 5 means a large expected contribution.
- Confidence: 1 means mostly conjecture; 5 means repeated evidence from the relevant population.
- Effort: 1 means a small, reversible change; 5 means a high-cost or cross-team change.
It then applies (impact × confidence) / effort and rounds only for display:
| Candidate action | Evidence or assumption | Impact | Confidence | Effort | Score | Owner | Next action |
|---|---|---|---|---|---|---|---|
| Clarify the first-run setup sequence and remove one redundant choice | Funnel shows a large exit at the choice; interviews describe uncertainty | 5 | 4 | 2 | 10.0 | Product lead | Prototype and test the shorter sequence |
| Add a role-based setup checklist | Different roles report different first-value paths | 4 | 4 | 3 | 5.3 | Customer success ops | Define role paths and validate with five moderated sessions |
| Add progress visibility to setup | Incomplete accounts often return but cannot see remaining work | 4 | 3 | 3 | 4.0 | Design lead | Test a progress concept with returning users |
| Offer a default concierge session to every new account | Assisted accounts appear to activate more often, but selection bias is likely | 3 | 2 | 5 | 1.2 | Success lead | Run a bounded randomized pilot before scaling |
The arithmetic is reproducible: the first score is (5 × 4) / 2 = 10; the second is (4 × 4) / 3 = 5.33. The ordering does not prove that the first action will close the 19-point activation gap. It says that, under the stated ratings, the first action deserves earlier validation.
The team records dependencies too. Changing setup requires analytics QA; the role-based checklist needs a stable role taxonomy; and the concierge pilot needs an evaluation design that addresses selection bias.
Turn the result into a decision
The product lead owns the activation row and schedules a September 15 review. The first action is a prototype, not a full rollout. The team agrees in advance to look for fewer setup errors, no loss of necessary configuration, and a pilot result using the same activation definition.
If the prototype fails, the team updates confidence rather than rewriting the old score. If the setup change improves completion but activation remains flat, the gap analysis stays useful: it shows that the assumed connection needs revision and that another cause or segment should be investigated.

Gap analysis vs. SWOT, root-cause analysis, and needs assessment
These methods can work together, but they answer different questions.
| Method | Primary question | Useful output | Main limitation |
|---|---|---|---|
| Gap analysis | What differs between the current and target states? | Comparable gaps and prioritized next actions | Does not establish the cause |
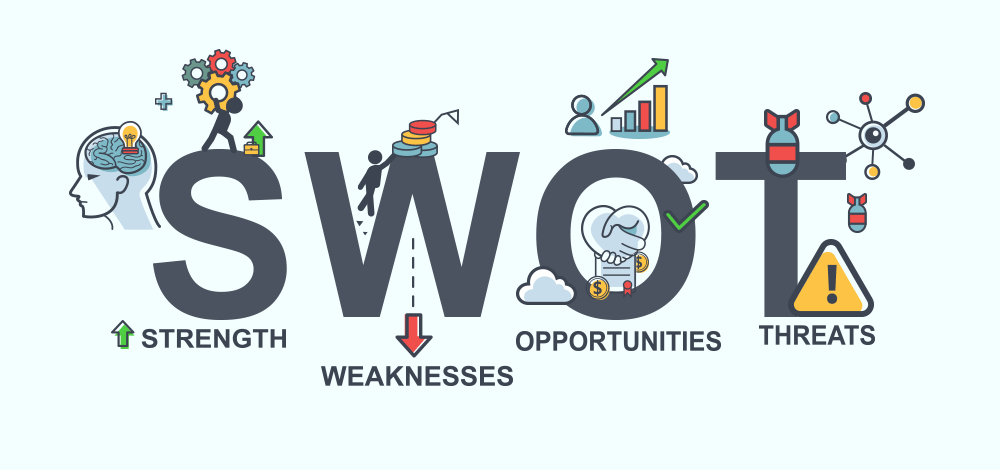
| SWOT analysis | Which internal strengths/weaknesses and external opportunities/threats matter? | Structured strategic context | Categories can stay broad or subjective |
| Root-cause analysis | What evidence-supported conditions produced a defined problem? | Tested cause statement and corrective actions | Needs a bounded problem and adequate evidence |
| Needs assessment | What needs exist, for whom, and which deserve attention? | Prioritized needs and stakeholder context | A stated need is not automatically a solution requirement |
Use a SWOT analysis template to widen the strategic context. Use competitive-analysis templates or the editable competitor analysis template to organize market evidence, but never copy a competitor's state as your target without testing relevance.
Use root-cause analysis after a material gap is verified and the mechanism is uncertain. Use a needs assessment when stakeholder needs, populations, or service priorities must be understood before the target is fixed.

Common gap analysis mistakes
- Unlimited scope. Split “digital transformation” into an outcome, boundary, population, and decision.
- An aspirational target with no basis. Record who approved it, by when, and why it fits.
- Mismatched definitions. Do not subtract a monthly account rate from a weekly user rate.
- The gap presented as its cause. “Low adoption” restates the outcome; it does not explain it.
- A favorite solution selected early. Record alternatives and test the riskiest assumption first.
- False precision. Use defined states when evidence cannot support a numeric score.
- No confidence or dependencies. A high-impact idea with weak evidence needs a test, not an automatic rollout.
- No accountable owner or review. Preserve assumptions, assign one owner, date results, and revise the decision when evidence changes.
How often should you review a gap analysis?
Set the cadence by volatility and decision timing. An operational gap may need a sprint review, a capability plan a quarterly review, and compliance readiness its formal milestones.
Also reopen a row after a changed target, new baseline, failed test, dependency, policy update, or side effect. Date material changes instead of silently rewriting history.
How to organize the workflow in AFFiNE
In AFFiNE, keep the scope, evidence notes, reusable table, assumptions, and decisions in one page. Use the Edgeless view when the team needs to map relationships among gaps, possible causes, dependencies, and actions, then return to the structured page for accountable follow-up. Verify current product behavior before relying on any workflow in production.
AFFiNE can help a team organize documents, visual relationships, links, and collaborative review. It does not automatically discover gaps, validate analytics, calculate the right priority, or prove that an intervention caused an outcome. People remain responsible for data definitions, access, method choice, decisions, and review.
Frequently asked questions
What is a gap analysis template?
A gap analysis template compares a documented current state with a defined target. It records evidence, the difference, impact, effort, priority, owner, next action, and review date without pretending to prove causation.
What are the four steps in a gap analysis?
Define a bounded scope and target; document comparable states; quantify or categorize each gap; then prioritize actions with evidence, impact, confidence, effort, dependencies, ownership, and a review date.
What is the difference between gap analysis and SWOT analysis?
Gap analysis compares a current state with a target and plans the work between them. SWOT organizes internal strengths and weaknesses plus external opportunities and threats. SWOT informs context; gap analysis makes a defined difference explicit.
How do you quantify a qualitative gap?
Define observable states such as absent, drafted, reviewed, approved, tested, and operating, then record evidence for each category. If using a 1-5 scale, define every level and preserve uncertainty.
Who should own a gap analysis?
Choose one owner to maintain evidence, convene contributors, and bring decisions to the approver. Actions can have different owners, and affected people should still inform the analysis.
How often should a gap analysis be reviewed?
Use a fixed date plus triggers such as a changed target, new baseline, failed test, dependency, or side effect. There is no universal cadence for every type of gap.
Do you need Excel for a gap analysis?
No. Spreadsheets suit many rows and formulas; documents suit evidence and narrative decisions; whiteboards clarify relationships. Choose an accessible format and keep one controlled source of truth.
Turn the comparison into a testable next action
A strong gap analysis template makes the current state, future state, evidence, difference, owner, and next decision visible. Copy the table, start with one bounded outcome, and test the highest-risk assumption before scaling a solution. Keep the analysis close to the evidence, and update it when results challenge the original plan.
Last reviewed: August 15, 2026.
Recommended review: an operations or process-improvement practitioner should verify the example, scoring assumptions, and terminology before publication.