Pareto Chart: How to Build One With a Worked Example
A Pareto chart is a prioritization graph that arranges categories from the largest measured count or impact to the smallest, then overlays a cumulative-percentage line. The descending bars show which categories contribute most to the observed total; the line shows how quickly those categories add up. It helps a team decide where to investigate first, but it does not prove why a problem happened.
The chart is especially useful when a backlog feels flat: twenty categories may be listed, yet only a few account for much of the measured workload. Turning the same observations into a ranked view makes concentration visible. The result is a starting point for questions and action, not a substitute for judgment, customer evidence, or root-cause analysis.
What is a Pareto chart?
The American Society for Quality's Pareto resource describes the method as a bar graph whose bars represent frequency or cost and are arranged with the longest bars on the left. A typical version adds a cumulative line, read against a percentage axis, so a reader can see how much of the total is covered as each category is included.
That combination answers a focused question: Which categories account for the largest share of the quantity we chose to measure? The quantity might be incident count, rework hours, delay minutes, warranty cost, or another consistently collected measure. A chart of counts should not be interpreted as a chart of cost or severity. If a rare category creates disproportionate risk, build a second view with the relevant measure or investigate it separately.
Pareto charts are often associated with the 80/20 rule. Treat 80% as a useful reference line, not a result the data is required to produce. Real distributions may cross 80% after two categories, ten categories, or not at a useful boundary at all. The chart should reveal the observed distribution rather than force it to match a slogan.
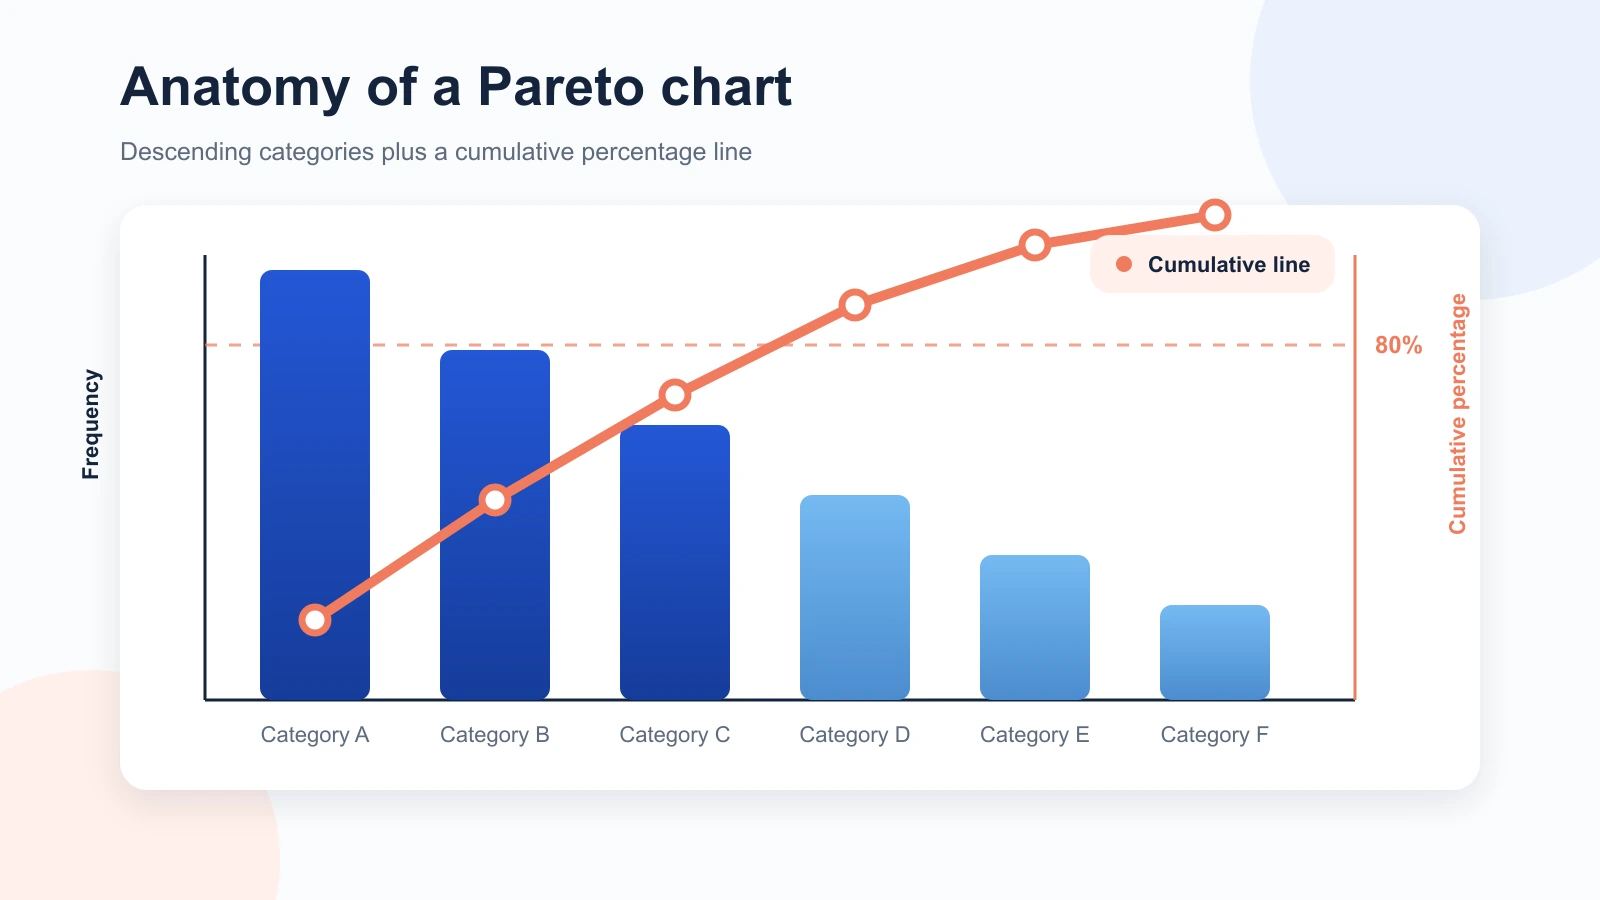
A Pareto chart combines ranked bars with a cumulative line. Both axes and the measured unit must be labeled.
Pareto chart anatomy
A readable chart has a small set of auditable parts:
| Part | What it represents | Check before interpreting |
|---|---|---|
| Categories | Mutually understandable groups such as issue types | Definitions are stable enough that two reviewers classify the same observation consistently |
| Descending bars | Count, cost, time, or another single measure | Bars use one unit and are sorted largest to smallest |
| Left axis | The magnitude represented by each bar | The unit and collection window are named |
| Cumulative line | Running share of the total after each category | Values are calculated from the same observations as the bars |
| Right axis | Cumulative percentage from 0% to 100% | The scale is clearly separated from the bar axis |
| Reference line | An optional threshold such as 80% | The threshold supports discussion; it is not treated as a law |
Before drawing anything, keep the source data beside the chart. A graphic without an inspectable table makes it hard to find duplicate observations, inconsistent labels, or arithmetic errors.
Copyable source and calculation table
| Category | Count or measured value | Cumulative count | Share of total | Cumulative share | Evidence note | Follow-up owner |
|---|---|---|---|---|---|---|
| Category A | Source and date | |||||
| Category B | Source and date | |||||
| Category C | Source and date | |||||
| Other | Inclusion rule | |||||
| Total | 100% | 100% | Collection window |
The evidence note matters because category names alone can hide a change in logging rules or sampling. The follow-up owner does not make the chart a task tracker; it keeps the next investigation from becoming anonymous.
How to make a Pareto chart in five steps
The mechanics are simple, but the result is only as dependable as the collection and category decisions behind it.
1. Define categories and the decision scope
Write the decision the chart should support, the measured unit, the population, and the time window. Then define category inclusion and exclusion rules. A label such as “performance” is too vague if one reviewer puts sync failures there and another uses it only for slow page loads.
Keep categories at a comparable level. Mixing a broad category such as “account issues” with a narrow one such as “expired reset link” will usually distort the ranking. If the purpose is unclear or the categories overlap heavily, resolve those definitions before collecting more data.
2. Collect comparable observations
Use observations drawn from the same process and window. Remove exact duplicates only when they are truly duplicate records, not repeated customer experiences. Record missing or unclassified items rather than silently discarding them.
If the sample combines different units, teams, products, or policy periods, split it or label the segmentation. A single total can conceal the fact that one category dominates only in a particular customer segment or week.
3. Sort categories by count
Aggregate the chosen measure for each category and sort the results from largest to smallest. Preserve an “Other” category only when its inclusion rule is explicit and its size remains interpretable. A large Other bar is a signal to revisit classification, not a convenient place to hide unclear records.
Check that the sorted category values add to the same grand total as the source observations. This reconciliation catches omissions before they become polished graphics.
4. Calculate cumulative percentages
Add the sorted values as a running total. For each row, calculate:
Cumulative percentage = cumulative count / grand total × 100
If the first two categories contain 32 and 24 observations in a 100-observation sample, their cumulative count is 32 + 24 = 56, and their cumulative percentage is 56 / 100 × 100 = 56%. Retain enough precision to audit the calculation, then round consistently for display.
5. Plot, interpret, and verify
Plot the descending category values as bars and the cumulative percentages as a line. Label both axes and the time window. If you use a spreadsheet, Microsoft's current Pareto chart guidance documents Excel's built-in chart path; the category and evidence checks still happen before the software step.
Verify the plotted values against the source table. Then state what the chart shows in measured language: which categories account for the largest share, where a reference threshold is crossed, and what the team will investigate. Do not write “these are the causes” unless a separate causal analysis supports that conclusion.
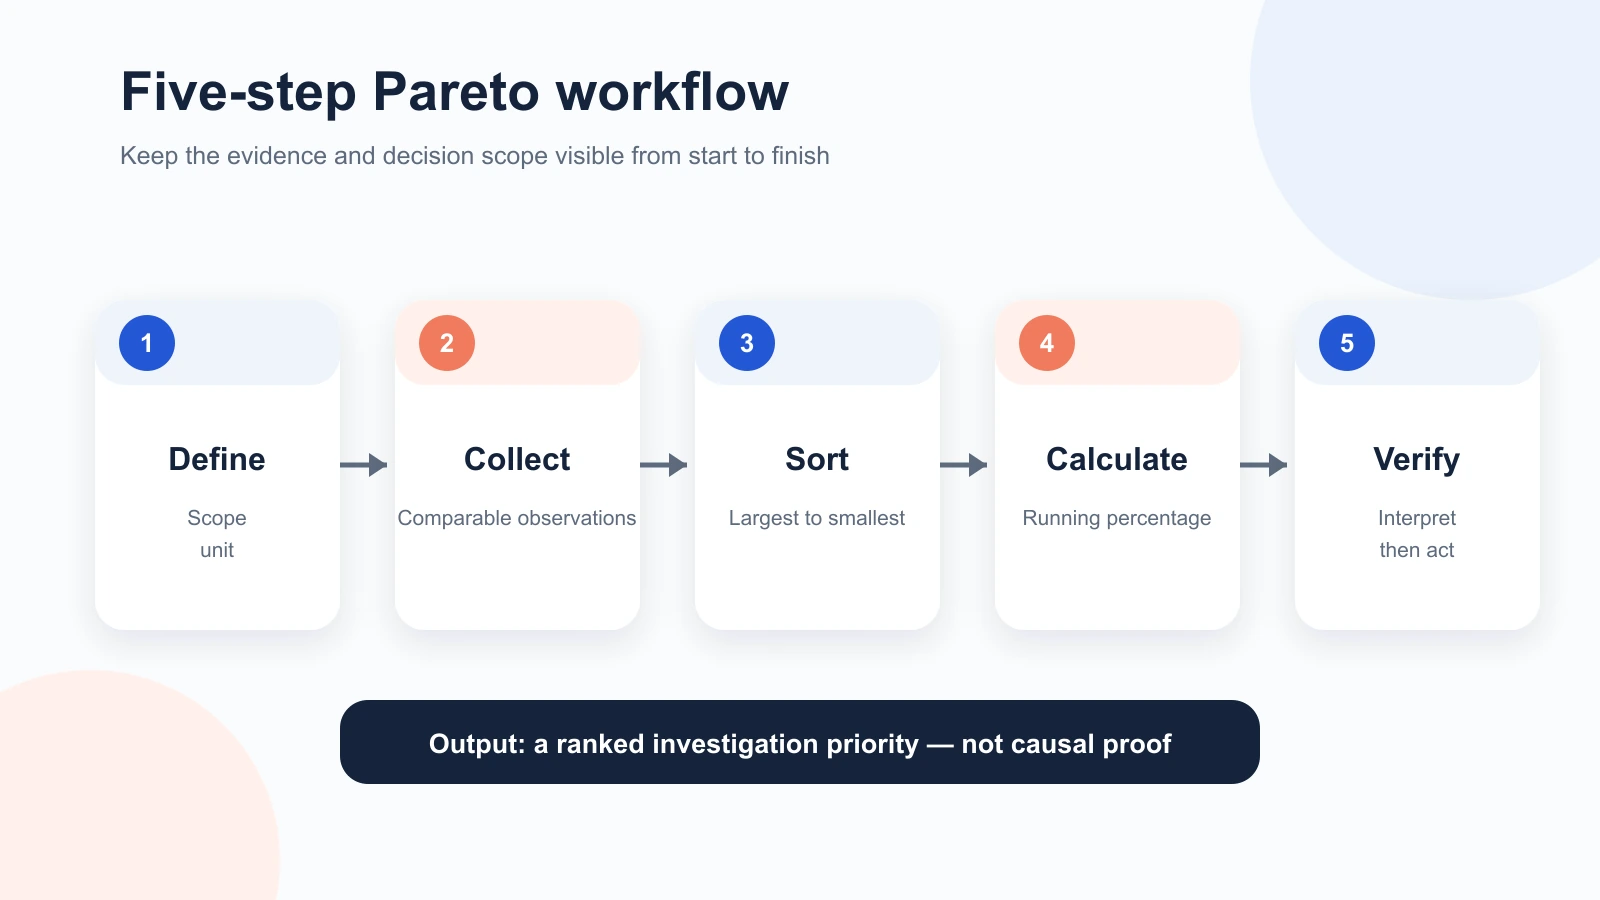
Define, collect, sort, calculate, and verify. Skipping the first two steps produces a precise-looking answer to an unstable question.
Worked Pareto chart example: 100 fictional support tickets
This fictional example shows the method; it is not AFFiNE customer data or a benchmark. Imagine a support lead reviews 100 tickets from one defined week. Each ticket is assigned to one primary category using rules agreed before the review.
| Rank | Ticket category | Count | Cumulative count | Share | Cumulative share |
|---|---|---|---|---|---|
| 1 | Login or access | 32 | 32 | 32% | 32% |
| 2 | Billing | 24 | 56 | 24% | 56% |
| 3 | Sync | 18 | 74 | 18% | 74% |
| 4 | Export | 12 | 86 | 12% | 86% |
| 5 | Notifications | 8 | 94 | 8% | 94% |
| 6 | Other | 6 | 100 | 6% | 100% |
| Total | 100 | 100% |
The first row is 32 / 100 × 100 = 32%. After Billing, the cumulative calculation is (32 + 24) / 100 × 100 = 56%. After Sync, the running share is 74%. The 80% reference is therefore not crossed after the first three categories. It is first crossed after Export, when the cumulative count reaches 86 tickets.
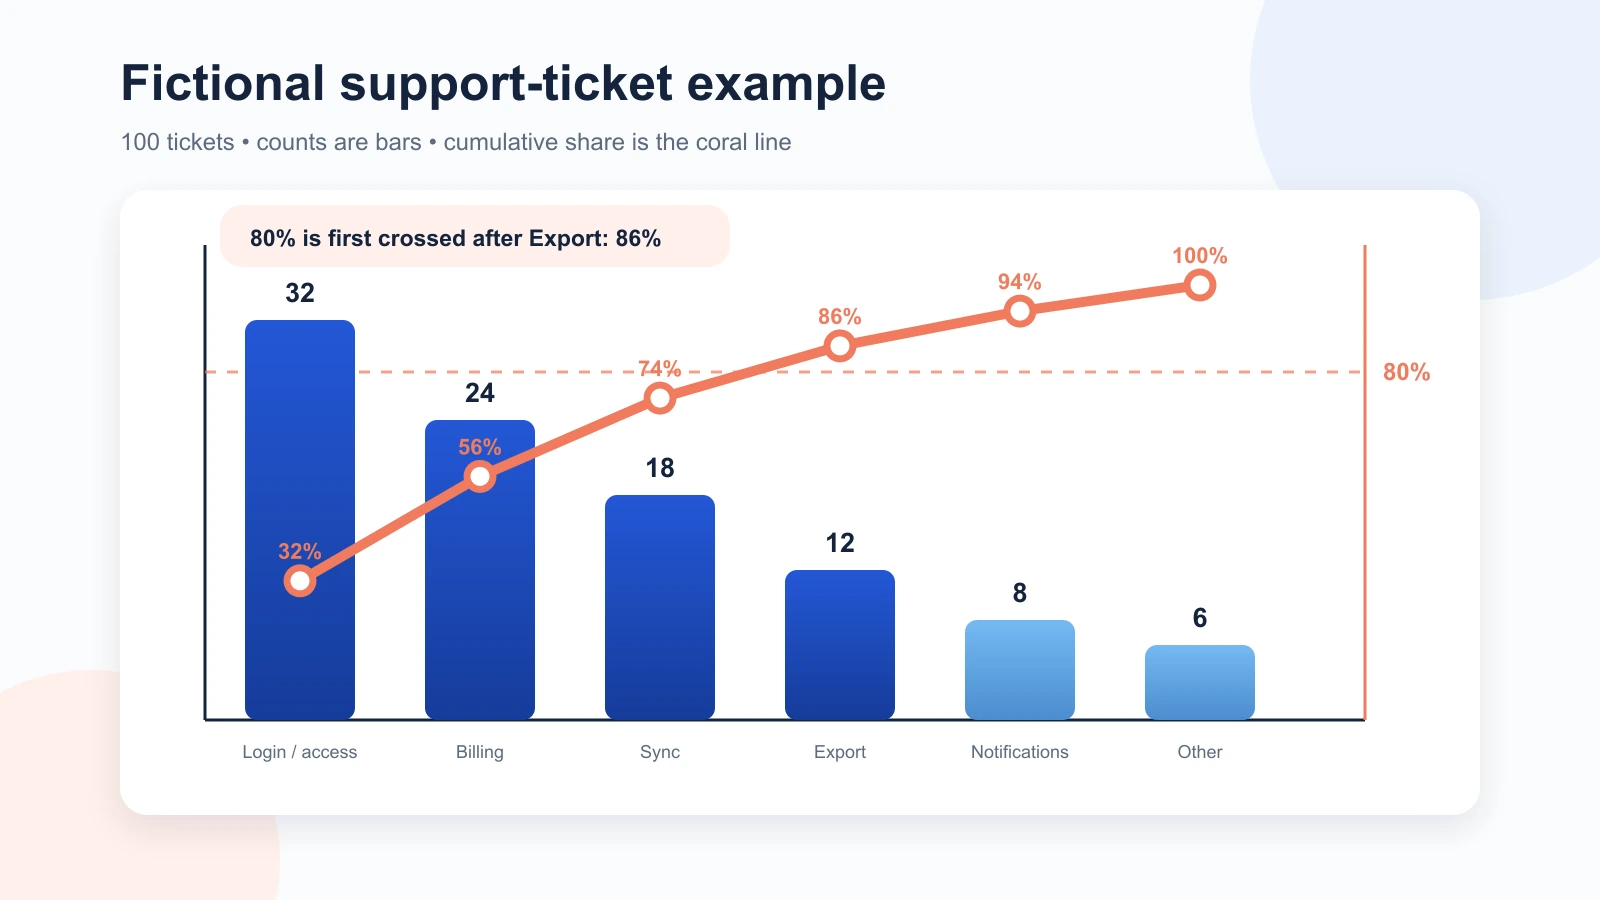
The first four categories reach 86%. The chart prioritizes investigation; it does not say those categories share one cause.
A responsible interpretation might read: “Login or access, Billing, Sync, and Export account for 86 of the 100 tickets in this defined sample, so we will review those category definitions and investigate each workflow first.” It should not read: “Fixing four causes will remove 86% of tickets.” The bars are categories of observed outcomes, not verified causes, and categories can contain multiple mechanisms.
The ranking also depends on the measure. If Billing tickets are frequent but quick to resolve, while a rare data-loss issue creates much greater harm, frequency alone should not set the entire priority. Build a severity or cost view, use risk controls, and escalate critical exceptions independently.
How to interpret a Pareto chart responsibly
Ask these questions before turning the ranking into work:
- What is the unit? A ticket, affected account, incident, hour, and dollar are different measures.
- Is the window stable? A release, outage, policy change, or campaign can make one short period unrepresentative.
- Are categories reliable? Reclassify a sample independently to see whether reviewers apply the same definitions.
- Can records appear twice? Decide whether repeat contacts are separate workload or duplicate logging.
- What does Other contain? If it is large, examine it before assuming the named bars are complete.
- Does frequency reflect impact? Add severity, cost, time, or risk evidence when the decision requires it.
- Would segmentation change the result? Compare product, region, plan, or time period only when the segments are valid and privacy-safe.
The chart can guide the next diagnostic step. A root-cause analysis template helps move from a concentrated symptom category to evidence about mechanisms. A fishbone diagram template can structure cause hypotheses without confusing hypotheses with proof.
When the decision is about the distance between present and desired performance, use a gap analysis template. When the team has candidate interventions, a decision matrix template can compare them across explicit criteria rather than frequency alone.
Pareto chart vs. bar chart, histogram, and fishbone diagram
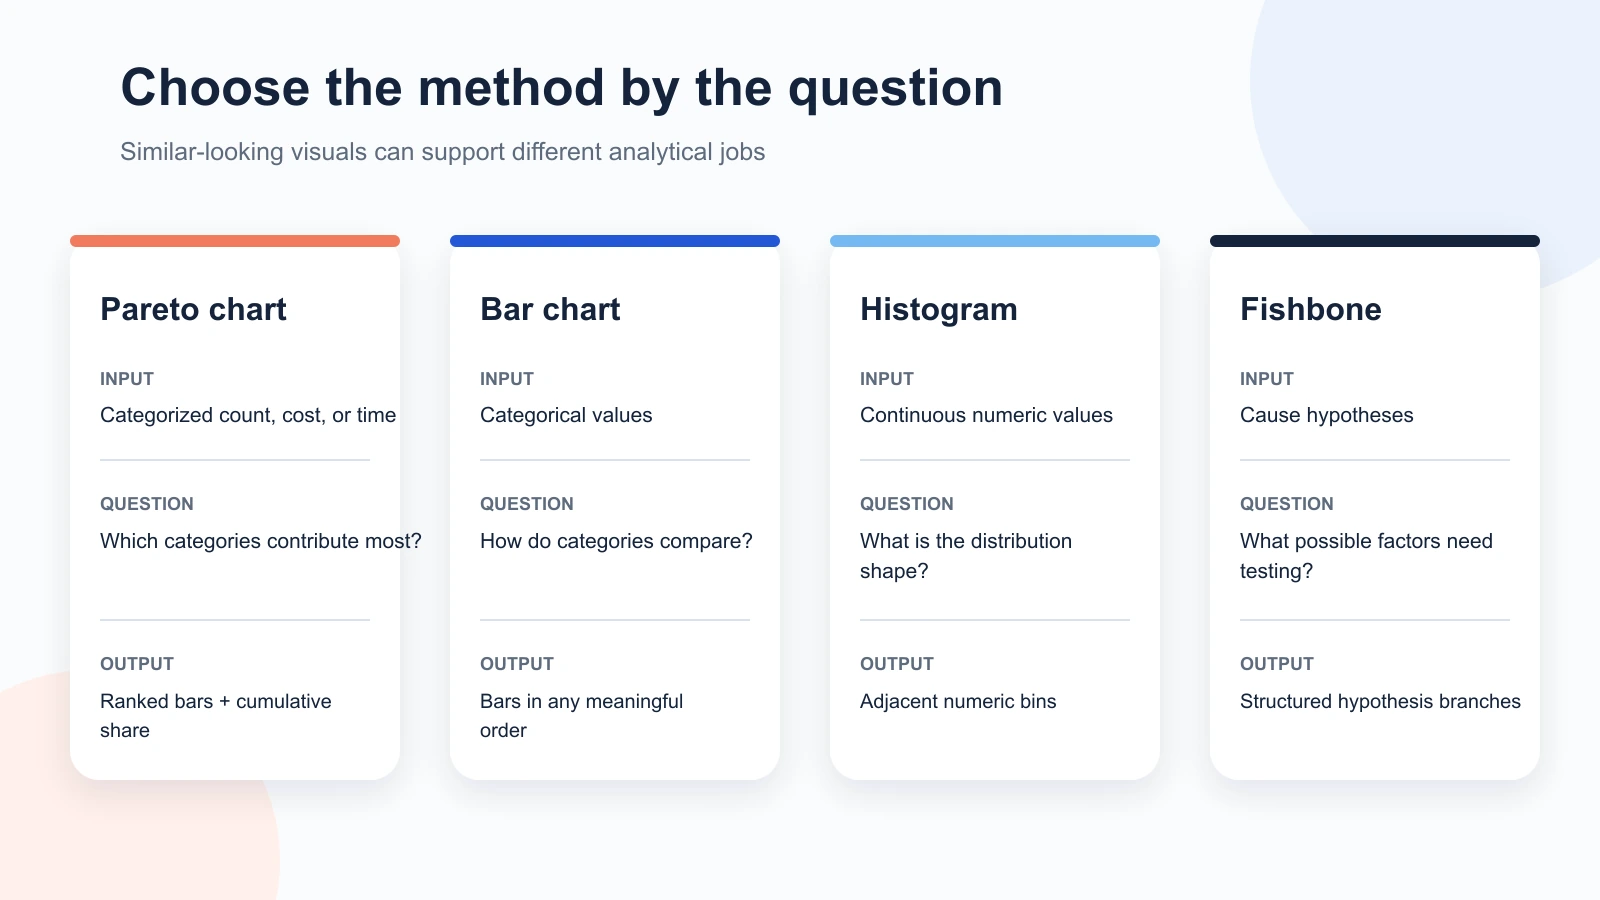
| Method | Best input | Main question | Typical output |
|---|---|---|---|
| Pareto chart | Categories with a comparable count, cost, or duration | Which categories contribute most to the measured total? | Descending bars plus cumulative share |
| Ordinary bar chart | Categorical values in any meaningful order | How do category values compare? | Bars without a required descending order or cumulative line |
| Histogram | Numeric observations grouped into intervals | How is a continuous measure distributed? | Adjacent bins showing shape and spread |
| Fishbone diagram | Structured cause hypotheses | What possible factors should we investigate? | Cause categories and branches, not measured contribution |
A Pareto chart is a specialized bar chart, but the sort order and cumulative line change its analytical job. A histogram is not a substitute because bins represent ranges of a numeric variable rather than named issue categories. A fishbone diagram begins where a Pareto ranking often ends: it organizes possible explanations for further testing.
Common mistakes and practical limits
Treating a reference threshold as a guarantee
Do not adjust categories until the chart looks like 80/20. Report the real crossing point—or report that no useful break appears.
Confusing frequency with importance
A high count can represent repeated low-impact friction. A low count can represent severe risk. Name the measure and add other decision evidence.
Changing category rules mid-sample
If definitions change, reclassify the affected records or split the time windows. Otherwise, bar differences may reflect logging policy rather than process performance.
Using tiny or unstable samples without a caveat
There is no universal minimum sample size for every operational use. State the sample, window, and volatility. Compare subsequent periods before committing major resources when the distribution is unstable.
Stopping at the chart
Ranking categories is not improvement. Assign an investigation owner, define evidence to collect, and turn supported decisions into an action plan with owners and review dates.
Hiding uncertainty in polished visuals
Document exclusions, missing observations, category disagreements, and rounding. A plain chart with visible assumptions is more useful than an impressive graphic that cannot be audited.
Keep the analysis reviewable in AFFiNE
A shared AFFiNE workspace can hold the category dictionary, source table, calculation notes, review comments, and follow-up owners together. Teams can use a document for the auditable record and a whiteboard for relationships or investigation notes, while keeping the numerical calculation in a tool that can be checked independently. AFFiNE does not turn weak categories into valid evidence or make the prioritization decision for the team.
Start-now checklist
- Write one decision and one measured unit.
- Define the collection window and category rules.
- Reconcile category totals with source observations.
- Sort, calculate, and independently check cumulative percentages.
- State the concentration without claiming causation.
- Add severity, cost, or risk evidence when frequency is insufficient.
- Assign the next investigation and review trigger.
Frequently asked questions
What is a Pareto chart?
A Pareto chart ranks categories from the largest measured value to the smallest and adds a cumulative-percentage line. It helps identify which categories contribute most to the observed total so a team can choose where to investigate first.
What is the difference between a Pareto chart and a bar chart?
An ordinary bar chart can use any meaningful category order. A Pareto chart requires descending bars and normally adds a cumulative line, making concentration and threshold crossing visible.
Does a Pareto chart always follow the 80/20 rule?
No. Eighty percent is a reference, not a required result. Use the actual distribution and report where the cumulative line crosses the chosen threshold, if it crosses at a useful category boundary.
How do you calculate cumulative percentage in a Pareto chart?
Add category values from largest to smallest, divide each running total by the grand total, and multiply by 100. Check that the final cumulative value equals 100%, allowing only explained rounding differences.
Do you need Excel to make a Pareto chart?
No. A spreadsheet or charting tool is convenient, but the essential work is defining categories, collecting comparable values, sorting them, and calculating cumulative percentages. The source table can be checked independently of the chart software.
Can a Pareto chart find root causes?
No. It prioritizes measured categories. Use root-cause methods and additional evidence to test why a concentrated category occurs; do not treat the largest bars as proven causes.
How often should you update a Pareto chart?
Update it when enough new comparable observations could change the decision, or after a relevant process, product, or logging change. Choose the cadence from volume and volatility rather than applying one universal schedule.
Conclusion
A useful Pareto chart is more than bars sorted from high to low. It preserves a clear unit, consistent categories, an auditable source table, correct cumulative percentages, and a measured interpretation. In the fictional example, four categories reach 86% of tickets; that finding sets an investigation order, not a causal conclusion. Build the simplest chart your evidence supports, then connect it to diagnosis, accountable action, and review.
Last reviewed: August 15, 2026.
Recommended review: a quality-improvement or operations practitioner should verify the category definitions, arithmetic, interpretation, and terminology before publication.