Decision Matrix Template: Weighted Scoring With Examples
A decision matrix template is a structured table for comparing named options against explicit criteria with one consistent rating scale. In a weighted decision matrix, each criterion also receives a weight, so priorities with greater importance exert more influence on the total.
The arithmetic is useful only when the inputs are defensible. A score cannot discover a missing option, create evidence, make an ethical or compliance judgment, or authorize a purchase. It makes assumptions and tradeoffs visible for an accountable owner.
Definition: A decision matrix is a comparison method that rates alternatives against defined criteria. A weighted version multiplies each rating by an agreed weight, adds the contributions, and treats the result as decision support rather than an automatic answer.
This guide includes a copyable structure and a fully reproducible software-selection example. Northstar, Cedar, and Harbor are fictional labels. Their ratings and results are teaching data—not AFFiNE customers, real products, market research, or an AFFiNE procurement decision.
When should you use a decision matrix?
Use a decision matrix for a bounded decision, viable shortlist, operational criteria, and evidence that can be compared on a shared scale. It helps when participants value different aspects of the choice.
Typical uses include selecting software, prioritizing a project, comparing locations, or evaluating solution approaches. It is less useful before the problem is framed or while important alternatives are missing.
Test non-negotiable legal, security, accessibility, budget, or technical gates before scoring. A high usability rating should not compensate for failing a mandatory security control.
The official ASQ decision matrix resource describes the method as a way to evaluate and prioritize a list of options against criteria important to the decision. That framing matters: the matrix organizes evaluation; it does not manufacture certainty.
Copyable decision matrix template
Start with one row per criterion and keep definitions and evidence beside the scores. Add one rating column and one weighted-contribution column for each option.
| Criterion | Operational definition | Weight | Evidence source | Evidence owner | 1-5 anchor | Option A rating | A contribution | Option B rating | B contribution | Uncertainty / note | Validation |
|---|---|---|---|---|---|---|---|---|---|---|---|
| Name one distinct factor | State what qualifies and what is out of scope | 0-100% | Test, document, record, or interview | Person responsible for evidence | Use the shared scale below | 1-5 | Weight × rating | 1-5 | Weight × rating | Gap, assumption, or disagreement | Draft / checked / approved |
Add option columns as required, but keep a screened shortlist and remove overlapping criteria.
Use this shared rating scale:
| Rating | Operational meaning |
|---|---|
| 1 | Materially misses the defined requirement |
| 2 | Has major gaps that require significant mitigation |
| 3 | Meets the documented minimum |
| 4 | Meets the requirement well with minor gaps |
| 5 | Exceeds the defined requirement with verified evidence |
“Good,” “flexible,” and “enterprise-ready” are not definitions. Specify the test. For integration fit, for example, list the required systems and acceptable mechanism; for total cost, define the period, included costs, currency, and assumptions.

Unweighted vs. weighted decision matrices
An unweighted matrix gives each criterion equal influence. Add the ratings or calculate their average. This is appropriate when the criteria are genuinely comparable in importance or when a lightweight first pass is enough.
A weighted matrix recognizes that some criteria matter more. If core workflow fit is more important than a minor cost difference, its weight should have a larger effect. Weighting is not automatically more rigorous: poorly defined or strategically adjusted weights can make a weak model look precise.
Set criteria and weights before viewing totals, and record who agreed to them. If stakeholder priorities differ, preserve the disagreement and test defensible weighting scenarios.
For percentage weights, make the total equal 100%. That convention makes the model easy to audit. Other normalized systems can work, but the calculation and denominator must be explicit.
Worked decision matrix example: software selection
Assume a fictional team has screened Northstar, Cedar, and Harbor against mandatory gates. It compares usability, workflow coverage, integrations, administration, cost, and implementation risk, with subject-matter owners verifying evidence.
Criteria and weights
| Criterion | What the team evaluates | Weight |
|---|---|---|
| Ease of use | Completion of representative tasks by intended users, with defined accessibility needs | 20% |
| Core workflow fit | Coverage of documented must-have workflows after mandatory gates | 25% |
| Integration fit | Verified support for the team's named systems and data flows | 15% |
| Security and admin | Evidence for required administrative and security controls | 20% |
| Total cost | Comparable three-year cost using the same scope and assumptions | 10% |
| Implementation risk | Migration, configuration, training, dependency, and rollback exposure | 10% |
| Total | 100% |
Replace these criteria with decision-specific definitions and check for overlap. Do not count the same migration difficulty inside workflow fit, total cost, and implementation risk without stating why.
Ratings and formula
The example uses the 1-5 anchors above. Ratings are assumed teaching inputs; they are not vendor claims.
| Criterion | Weight | Northstar | Cedar | Harbor |
|---|---|---|---|---|
| Ease of use | 20 | 4 | 5 | 3 |
| Core workflow fit | 25 | 5 | 4 | 4 |
| Integration fit | 15 | 3 | 4 | 5 |
| Security and admin | 20 | 4 | 3 | 5 |
| Total cost | 10 | 3 | 4 | 2 |
| Implementation risk | 10 | 3 | 4 | 3 |
For each cell:
weighted contribution = weight × rating
For each option:
total weighted score = Σ(weight × rating) ÷ 100
This keeps the result on the original 1-5 scale.
Recalculate every total
Northstar
(20×4 + 25×5 + 15×3 + 20×4 + 10×3 + 10×3) ÷ 100
= (80 + 125 + 45 + 80 + 30 + 30) ÷ 100 = 390 ÷ 100 = 3.90
Cedar
(20×5 + 25×4 + 15×4 + 20×3 + 10×4 + 10×4) ÷ 100
= (100 + 100 + 60 + 60 + 40 + 40) ÷ 100 = 400 ÷ 100 = 4.00
Harbor
(20×3 + 25×4 + 15×5 + 20×5 + 10×2 + 10×3) ÷ 100
= (60 + 100 + 75 + 100 + 20 + 30) ÷ 100 = 385 ÷ 100 = 3.85
| Provisional rank | Option | Weighted score |
|---|---|---|
| 1 | Cedar | 4.00 |
| 2 | Northstar | 3.90 |
| 3 | Harbor | 3.85 |
Cedar is the numerical leader by 0.10 over Northstar and 0.15 over Harbor. Those are close results, not evidence of a decisive advantage. Review confidence, disagreements, hard gates, and sensitivity before choosing.

Run a decision matrix sensitivity analysis
Sensitivity analysis asks whether a reasonable priority change alters the ranking. It is especially important when totals are close or weights were contentious.
In this example, suppose the accountable owner confirms that security and administration should carry 30%, not 20%. To keep the total at 100%, reduce ease of use from 20% to 10%. Leave the other weights unchanged. This is one controlled two-weight tradeoff, not a new rating exercise.
| Criterion | Baseline weight | Security-priority weight |
|---|---|---|
| Ease of use | 20% | 10% |
| Core workflow fit | 25% | 25% |
| Integration fit | 15% | 15% |
| Security and admin | 20% | 30% |
| Total cost | 10% | 10% |
| Implementation risk | 10% | 10% |
| Total | 100% | 100% |
Recalculate with the same ratings:
- Northstar:
(10×4 + 25×5 + 15×3 + 30×4 + 10×3 + 10×3) ÷ 100 = 390 ÷ 100 = 3.90 - Cedar:
(10×5 + 25×4 + 15×4 + 30×3 + 10×4 + 10×4) ÷ 100 = 380 ÷ 100 = 3.80 - Harbor:
(10×3 + 25×4 + 15×5 + 30×5 + 10×2 + 10×3) ÷ 100 = 405 ÷ 100 = 4.05
Harbor becomes the provisional leader. Northstar stays at 3.90 because its ease-of-use and security ratings are both 4; shifting weight between those criteria does not change its contribution. The ranking is sensitive to the ease-versus-security priority, so the decision record should explain which scenario reflects the actual need.

ASQ's option-comparison guidance treats the matrix as a structured aid, not a machine that makes the choice. Preserve that boundary: the highest numerical result may prompt selection, further evidence, mitigation, negotiation, or rejection.
How to create a decision matrix in eight steps
1. Frame the decision and mandatory gates
Write the decision, owner, scope, constraints, and outcome. List non-negotiable gates separately so unrelated strengths cannot compensate for failure.
2. Shortlist viable options
Remove clearly infeasible options and document exclusions. Record how alternatives were found and whether a “do nothing” or staged option belongs.
3. Define distinct criteria
Write each criterion so reviewers can identify the same evidence. Test for double-counting and correlation.
Connect criteria to an explicit objective. A SMART goal template can help clarify the measurable outcome, while current project planning templates can keep scope, owners, and checkpoints visible.
4. Choose the scale and evidence
Define one anchored scale before scoring. Name an evidence owner, attach the supporting record, and mark uncertainty rather than inventing confidence.
5. Set weights before rating
Allocate 100% and record the rationale. When stakeholders disagree, retain plausible scenarios for sensitivity testing.
6. Score independently, then reconcile
Have informed participants score independently. Preserve material disagreement and assign follow-up evidence instead of hiding it in an average.
7. Calculate totals and test sensitivity
Recalculate every contribution. Vary disputed weights or uncertain ratings within defensible ranges. If small changes reverse the leader, report sensitivity.
8. Record the accountable decision
The owner records the choice, evidence, matrix version, risks, mitigations, dissent, and review trigger. Track ongoing uncertainties in a RAID log when they require follow-through.

Decision matrix vs. RACI, RAID, pros-and-cons, and Pugh
| Tool | Primary question | Numerical comparison? | Best use |
|---|---|---|---|
| Pros-and-cons list | What arguments favor or oppose an option? | Usually no | Fast exploration with few tradeoffs |
| Decision matrix | How do viable options perform against anchored criteria? | Optional or weighted | Transparent comparison and sensitivity testing |
| RACI matrix | Who is responsible, accountable, consulted, or informed? | No | Clarifying roles around work or a decision |
| RAID log | Which risks, assumptions, issues, and decisions need tracking? | No | Maintaining delivery context and follow-up |
| Pugh-style matrix | How do concepts compare with a reference concept? | Relative symbols or scores | Screening design concepts against a baseline |
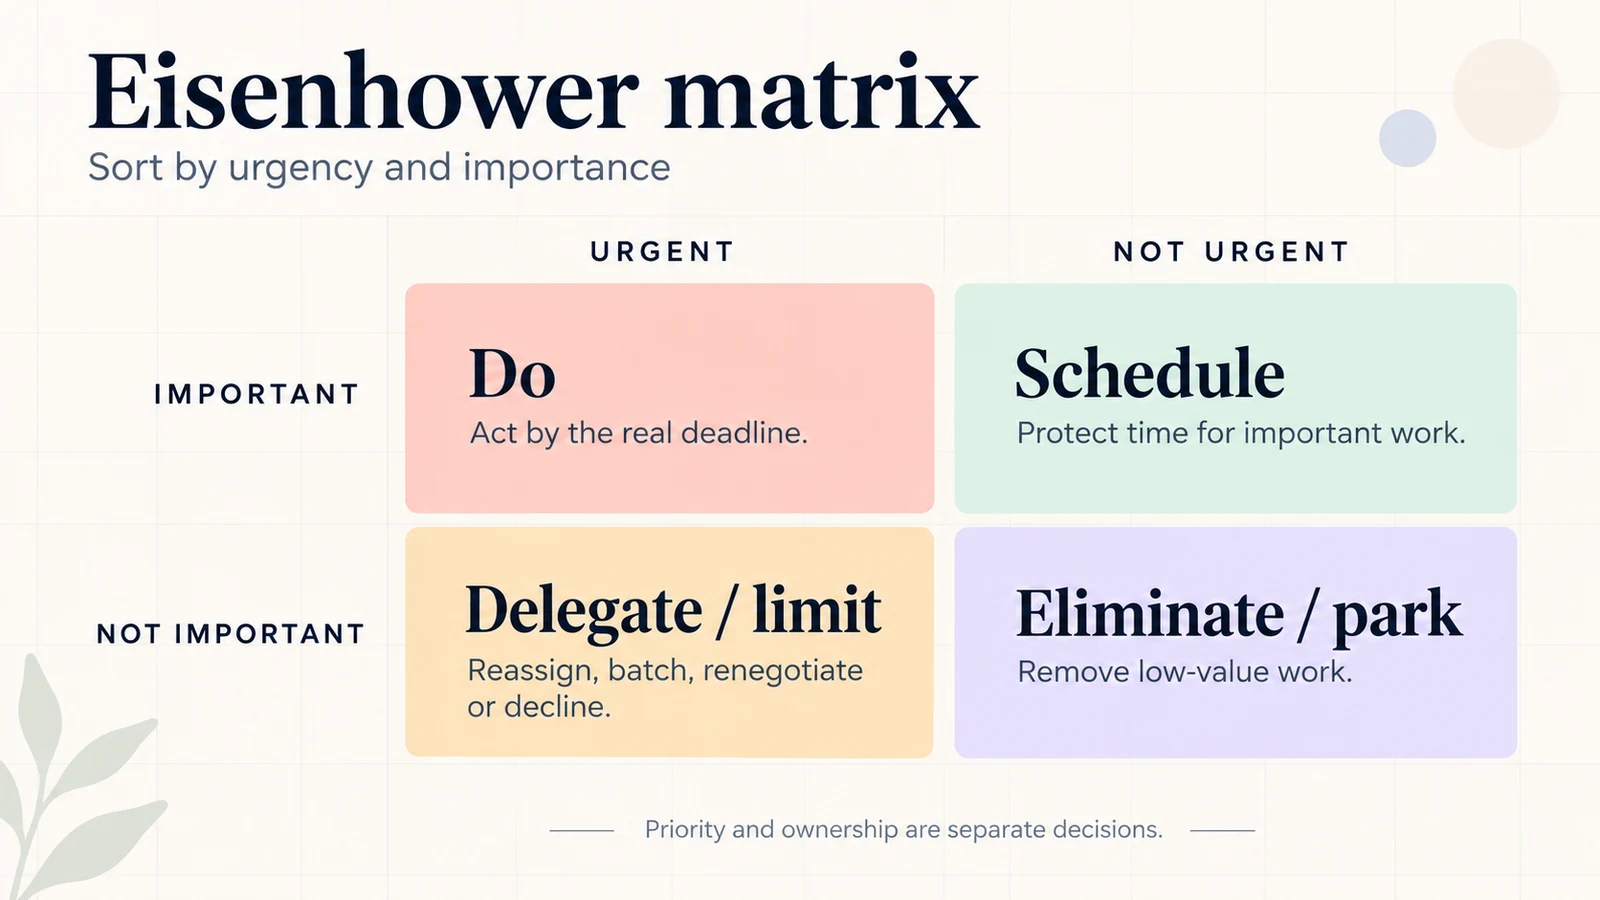
| Eisenhower matrix | Which tasks are urgent, important, both, or neither? | No | Sorting the tasks that follow a decision into do, schedule, delegate, or eliminate |
Do not use a decision score to assign ownership. Use a RACI chart guide or RACI matrix template to clarify participation and accountability around the evaluation.
A decision matrix ends when an option is chosen; it does not say which of the resulting tasks to do first. For that, sort the follow-up work with an Eisenhower matrix, which classifies each task by urgency and importance instead of scoring options against criteria.
A Pugh-style matrix emphasizes relative comparison with a baseline. A weighted decision matrix can instead use absolute, anchored ratings. Either approach fails when criteria are vague or evidence is weak.
Common decision matrix mistakes
- Overlapping criteria double-count one concern. Map each criterion to distinct evidence and remove hidden duplicates.
- Vague labels invite inconsistent ratings. Replace “quality” or “fit” with an operational definition.
- Weights change after the totals appear. Freeze the baseline first and label later scenarios as sensitivity tests.
- Opinions masquerade as evidence. Link each rating to a test, document, estimate, or disclosed assumption.
- Hard gates become tradeable. Screen non-negotiable requirements before compensatory scoring.
- Averages hide disagreement. Preserve ranges and reasons when informed evaluators differ materially.
- Decimals imply false precision. Round consistently and report uncertainty; 4.00 is not inherently meaningfully better than 3.90.
- Correlated criteria amplify one theme. Check whether cost, implementation effort, and implementation risk repeat the same exposure.
- The option set is incomplete. Document how the shortlist was created and what was excluded.
- The highest score becomes authorization. Keep an accountable owner, rationale, mitigations, and review trigger.
Reduce bias and keep the matrix accessible
Score independently before group discussion. Use neutral option labels when brand preference may distort judgment. Define criteria and weights before revealing totals; link dated evidence and preserve dissent.
For accessibility, do not communicate ratings or leaders through color alone. Pair color with labels, numbers, and symbols; use sufficient contrast; keep a logical reading order; make column headers explicit; and provide the table and formulas as text rather than only inside an image. Alt text should describe the relationship the image explains, not repeat the keyword.
Organize the decision in AFFiNE
Use an AFFiNE page to keep the decision statement, criteria definitions, evidence links, ratings, calculations, assumptions, and approval record together. Use Edgeless view when a team needs to arrange option evidence and tradeoffs spatially before translating them into the auditable table.
Verify current behavior before turning this into a team procedure. AFFiNE can organize documents, tables, links, visual relationships, and collaborative review. It does not automatically validate procurement evidence, eliminate bias, choose defensible weights, or make the decision.
Frequently asked questions
What is a decision matrix?
A decision matrix is a table that compares named options against defined criteria using a consistent rating scale. A weighted matrix gives more important criteria greater influence on the total.
How do you create a decision matrix?
Frame the decision and gates, shortlist viable options, define distinct criteria, choose an anchored scale and evidence, set weights, score independently, calculate totals, test sensitivity, and document the accountable decision.
What is the difference between a weighted and unweighted decision matrix?
An unweighted matrix gives each criterion equal influence. A weighted matrix multiplies ratings by agreed priorities. Weighting is useful only when importance genuinely differs and the weights are set transparently.
Do decision matrix weights have to total 100%?
Percentage weights should total 100% so contributions and the denominator are easy to audit. Other normalized systems can work if the formula and total are explicit and applied consistently.
What rating scale should a decision matrix use?
Use one anchored scale for every option. A practical 1-5 scale runs from materially missing the requirement to exceeding a defined requirement with verified evidence. Define the anchors before scoring.
What should you do when decision matrix scores are close?
Check evidence quality, disagreements, hard gates, and rounding, then run sensitivity scenarios on disputed weights or uncertain ratings. Close or unstable results should be reported as sensitive, not decisive.
Is a decision matrix the same as a RACI matrix?
No. A decision matrix compares options against criteria. A RACI matrix assigns who is responsible, accountable, consulted, and informed for work or decisions. They can be used together.
Start with a defensible decision, not a spreadsheet
A useful decision matrix template makes the model easier to challenge. Define the decision and gates, use distinct criteria, anchor the scale, attach evidence, set weights before rating, reproduce the arithmetic, and test whether reasonable priority changes alter the result. Then let the accountable owner record the choice and its limitations.
Last reviewed: August 15, 2026.
Recommended review: a business analyst or decision-quality practitioner should verify the criteria, arithmetic, sensitivity test, and accessibility before publication.