PERT Chart: Definition, Example, Formula, and PERT vs Gantt
A PERT chart is a network diagram that shows a project's activities as nodes, the dependencies between them as arrows, and an expected duration for each activity calculated from three estimates: optimistic, most likely, and pessimistic. Teams use it when durations are uncertain, such as a first-time launch, a research effort, or a project with unfamiliar vendors, and when they need to know which chain of activities sets the earliest realistic finish. PERT stands for Program Evaluation and Review Technique. It was developed in the late 1950s for the U.S. Navy's Polaris program, and its core idea has not changed: collect three estimates per activity, combine them into one expected time, then add expected times along every path through the network and find the longest.
This guide covers the definition, the expected-time formula with worked calculations, a complete fictional example you can recalculate by hand, a copyable template, and a side-by-side comparison with Gantt charts and other planning views.
Definition: A PERT chart is a project network diagram in which every activity carries an expected duration derived from optimistic, most likely, and pessimistic estimates, and arrows show which activities must finish before others can start.
Key takeaways
- The expected time for each activity is TE = (O + 4M + P) / 6, which weights the most likely estimate four times more than either extreme.
- The longest expected path through the network sets the earliest expected finish. In the fictional example below it is 33.67 working days, even though the eight activities add up to 54.67 days of work.
- Slack is the amount an activity or path can slip without moving the finish. Activities on the longest path have zero slack.
- A PERT chart answers "what depends on what, and how long will it probably take?" A Gantt chart answers "when does each task happen on the calendar, and how far along is it?"
- Expected times are only as good as the estimates behind them. The chart is a planning record, not a forecast guarantee.
In this article
- What is a PERT chart and when should you use it?
- PERT chart anatomy: nodes, arrows, milestones, paths, and slack
- The PERT formula: expected time from three estimates
- PERT chart example: a fictional nonprofit website relaunch
- Copyable PERT chart template
- How to make a PERT chart in seven steps
- PERT chart vs. Gantt chart, CPM, dependency map, and task list
- Common PERT chart mistakes
- Limitations: estimates, resources, and execution
- Accessibility and readability guidance
- Keep estimates, diagram, and decisions together in AFFiNE
- Frequently asked questions
- Sources
What is a PERT chart and when should you use it?
A PERT chart is the visual output of PERT, a scheduling method that treats activity durations as uncertain rather than fixed. The original 1959 paper by Malcolm, Roseboom, Clark, and Fazar in Operations Research described research and development work as a network of interrelated events in an ordered sequence, with time estimates for the connecting activities collected from technical staff and expressed probabilistically (Malcolm et al., 1959). MIT's ESD.36 course notes summarize the method as "CPM + probabilistic task times," suited to uncertain and new projects where little past data exists for durations (MIT OpenCourseWare, ESD.36 Lecture 9).
Use a PERT chart when:
- Durations are uncertain. Nobody on the team has done this exact work before, or the work depends on outside parties whose response times vary.
- Dependencies matter more than dates. You need to see which activities can run in parallel and which chain constrains the finish before anyone commits to a calendar.
- Stakeholders ask "how long will this take?" and you want an answer built from explicit ranges rather than one optimistic number.
A PERT chart is a poor fit when the work is routine and well-measured (a fixed-duration schedule is simpler), when the plan changes daily (the network becomes stale faster than it can be redrawn), or when the audience mainly needs calendar dates and status, which is the job of a Gantt chart.
PERT chart anatomy: nodes, arrows, milestones, paths, and slack
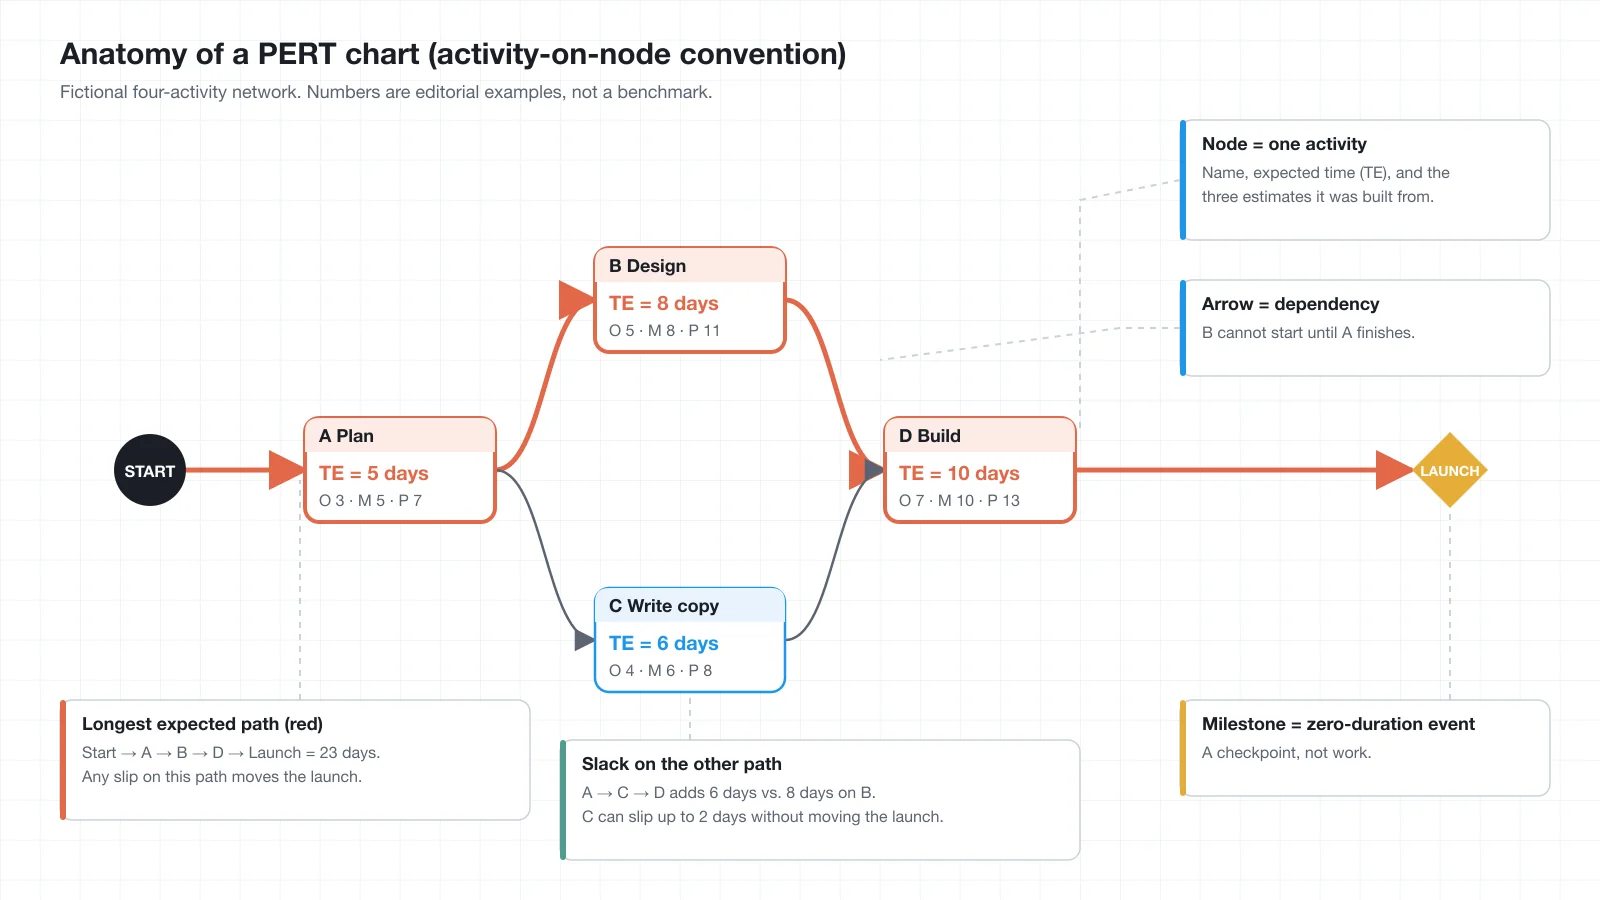
Nodes (activities). Each box is one unit of work with a clear finish condition. In the activity-on-node convention used throughout this article, the box carries the activity's name, its expected time (TE), and the three estimates it came from. The original PERT diagrams used the opposite convention, activity-on-arrow, in which arrows are the work and circles are events (MIT OpenCourseWare). Both conventions carry the same information; pick one and keep it consistent.
Arrows (dependencies). An arrow from A to B means B cannot start until A finishes. This is a finish-to-start dependency, the only type used in this article. If two activities have no arrow between them, directly or through other nodes, they can run in parallel.
Milestones. A milestone is a zero-duration event, such as "site live" or "content approved." Draw it with a different shape (a diamond or circle) so nobody reads it as work. Milestones are useful as merge points where several paths must all be complete.
Paths. A path is any route from start to finish following the arrows. A network with two branches that rejoin has at least two paths. The expected length of a path is the sum of the expected times of the activities on it.
Slack (float). Slack is how much an activity or path can slip before it delays the finish. The GAO Schedule Assessment Guide defines total float as "the amount of time a predecessor activity can slip before the delay affects the program's estimated finish date" (GAO-16-89G). In a PERT network, an activity's slack equals the longest expected path minus the longest expected path that runs through that activity.
The critical path relationship. The GAO guide defines the critical path as "the path of longest duration through the sequence of activities," the path that determines the earliest completion date (GAO-16-89G). That definition comes from the critical path method (CPM), which uses single fixed durations. A PERT chart applies the same longest-path logic to expected durations, so this article calls the result the "longest expected path." It is the PERT counterpart of the critical path. If you enter expected times into a scheduling tool, its output will still be labeled "critical path," but keep the distinction in mind: with three-point estimates, a different path can turn out to be the one that actually delays the finish. GAO makes the same point for schedule risk analysis, noting that the path most likely to delay a program may not be the critical path of the static schedule (GAO-16-89G).
The PERT formula: expected time from three estimates
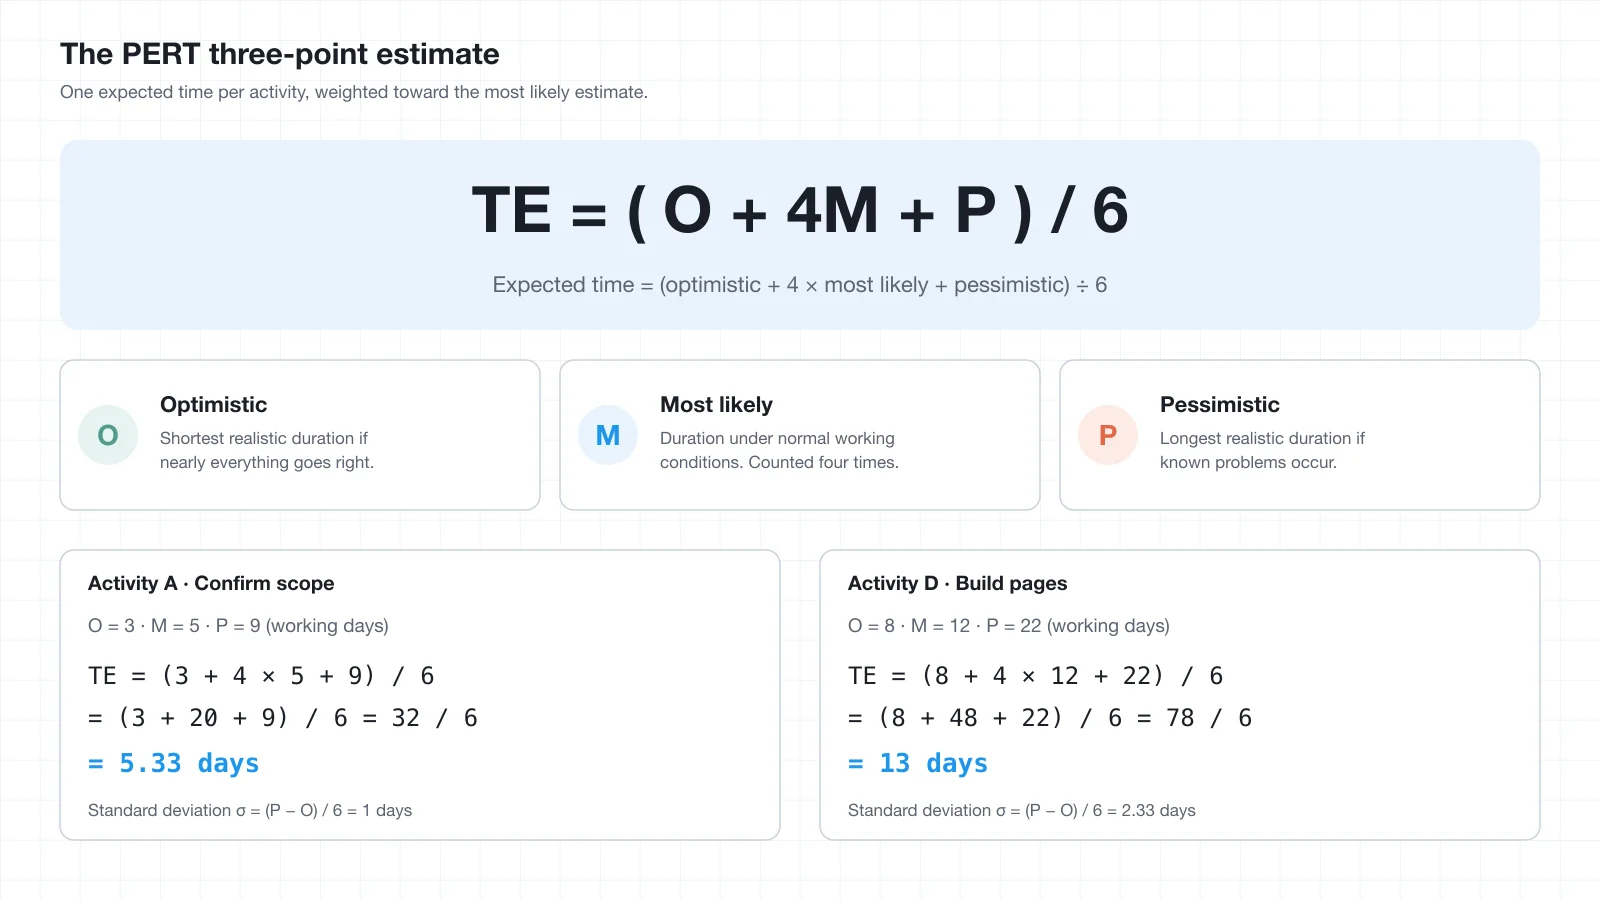
Every activity in a PERT chart gets three estimates from the people who will do the work:
| Symbol | Name | What it means |
|---|---|---|
| O | Optimistic time | The shortest realistic duration if nearly everything goes right. |
| M | Most likely time | The duration under normal working conditions, the value the estimator would bet on. |
| P | Pessimistic time | The longest realistic duration if known problems occur. Not "the sun explodes," but "the vendor is three weeks late." |
The expected time is the weighted average:
TE = (O + 4M + P) / 6
The weighting comes from the classic PERT assumption that an activity's duration follows a beta distribution bounded by O and P with its mode at M. The formula as written here, along with the variance formula below, appears in standard course material such as MIT's ESD.36 lecture on probabilistic scheduling and Washington State University's Engineering and Technology Management program notes (MIT OpenCourseWare; WSU ETM, 2023). The three-estimate approach itself goes back to the 1959 paper by the PERT team (Malcolm et al., 1959).
Worked calculation 1: activity A, "Confirm scope and sitemap." The team gives O = 3, M = 5, P = 9 working days.
TE = (3 + 4 × 5 + 9) / 6 = (3 + 20 + 9) / 6 = 32 / 6 = 5.33 days
Worked calculation 2: activity D, "Build pages." The developer gives O = 8, M = 12, P = 22 working days.
TE = (8 + 4 × 12 + 22) / 6 = (8 + 48 + 22) / 6 = 78 / 6 = 13 days
Notice that D's expected time (13) is above its most likely value (12) because the pessimistic estimate is far from the optimistic one. That asymmetry is the whole point of collecting three numbers: a wide downside pulls the expectation up.
PERT analysis: measuring spread along a path
PERT analysis goes one step beyond expected times. Each activity also gets a standard deviation and a variance:
σ = (P − O) / 6
Variance = σ²
For activity A, σ = (9 − 3) / 6 = 1.00 day. For activity D, σ = (22 − 8) / 6 = 2.33 days. The classic convention then adds the variances of the activities on a path and takes the square root to get the path's standard deviation, treating the path total as approximately normal (MIT OpenCourseWare). In the example below, the longest expected path has a combined variance of 10.17 and a standard deviation of about 3.19 days.
Treat that number as a rough width, not a confidence interval you can defend to a board. It relies on the beta assumption, on independent activities, and on estimators who understood what "pessimistic" meant. It also ignores the effect of parallel paths converging: when several paths must all finish before a milestone, the chance that at least one of them runs late is higher than the chance for any single path. Modern schedule risk analysis handles that with simulation rather than the hand formula, which is why GAO's guide treats three-point estimates as inputs to a statistical simulation and lists their drawbacks, including that a single pessimistic number may bundle several unrelated risks together (GAO-16-89G).
PERT chart example: a fictional nonprofit website relaunch
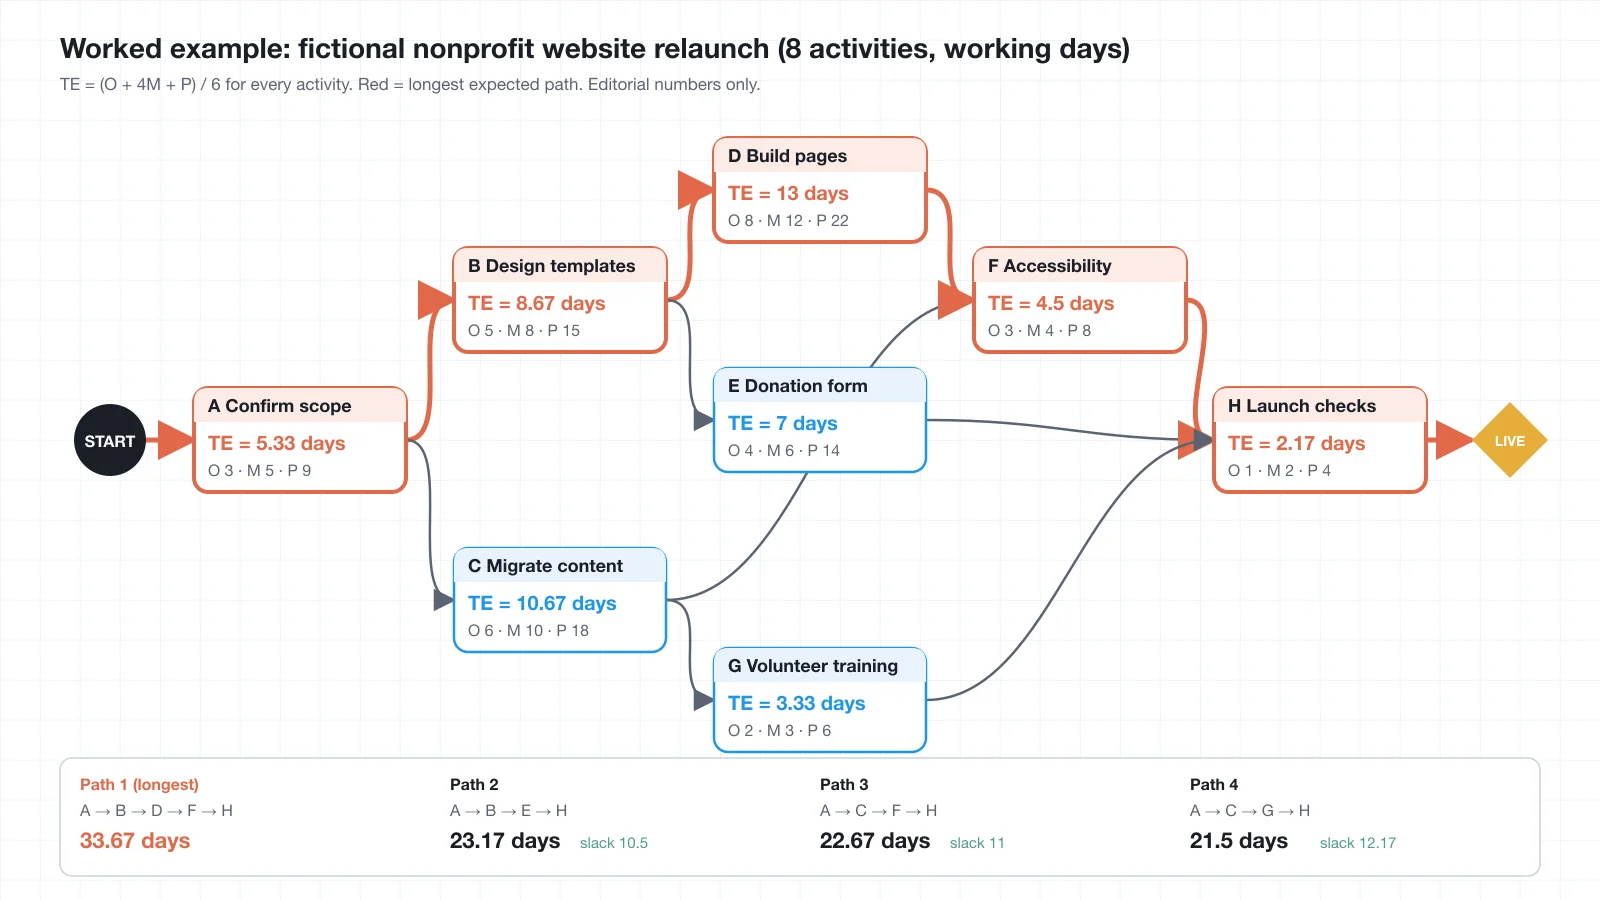
The example below is fictional and editorial: a small community food pantry that does not exist, relaunching its website. The estimates were chosen to be plausible and easy to check, and no real project, organization, or customer is involved. It uses eight activities, working days as the unit, and finish-to-start dependencies only.
Assumptions. One designer, one developer, one content lead, and a volunteer coordinator. The donation form is a third-party embed whose vendor response time is uncertain, which is why activity E has a wide range.
Activity register
| ID | Activity | Predecessors | O | M | P | TE = (O + 4M + P) / 6 | σ = (P − O) / 6 |
|---|---|---|---|---|---|---|---|
| A | Confirm scope and sitemap | — | 3 | 5 | 9 | 5.33 | 1.00 |
| B | Design page templates | A | 5 | 8 | 15 | 8.67 | 1.67 |
| C | Write and migrate content | A | 6 | 10 | 18 | 10.67 | 2.00 |
| D | Build pages | B | 8 | 12 | 22 | 13.00 | 2.33 |
| E | Integrate donation form | B | 4 | 6 | 14 | 7.00 | 1.67 |
| F | Accessibility review and fixes | C, D | 3 | 4 | 8 | 4.50 | 0.83 |
| G | Train volunteer editors | C | 2 | 3 | 6 | 3.33 | 0.67 |
| H | Launch and post-launch checks | E, F, G | 1 | 2 | 4 | 2.17 | 0.50 |
Values are rounded to two decimals for display. Path totals below are computed from the unrounded fractions (for example, A is exactly 32/6), so they may differ from a sum of the rounded numbers by 0.01.
Path register
| Path | Activities | Expected length (working days) | Slack vs. longest path |
|---|---|---|---|
| 1 | A → B → D → F → H | 5.33 + 8.67 + 13.00 + 4.50 + 2.17 = 33.67 | 0 (longest expected path) |
| 2 | A → B → E → H | 5.33 + 8.67 + 7.00 + 2.17 = 23.17 | 10.50 |
| 3 | A → C → F → H | 5.33 + 10.67 + 4.50 + 2.17 = 22.67 | 11.00 |
| 4 | A → C → G → H | 5.33 + 10.67 + 3.33 + 2.17 = 21.50 | 12.17 |
Longest expected path: A → B → D → F → H at 33.67 working days. Every activity on it has zero slack, so a one-day slip in design, build, accessibility review, scope, or launch checks moves the expected go-live by one day.
Slack by activity. Activity E (donation form) can slip 10.50 days, C (content) 11.00 days, and G (volunteer training) 12.17 days before any of them becomes the constraint. Those numbers are large because the build activity dominates the schedule. They are also the first thing to re-check when an estimate changes: if the content lead revises C to O = 12, M = 18, P = 30, C's expected time becomes 19.00 days, path 3 becomes 31.00 days, and C's slack shrinks to 2.67 days.
Sum of work vs. length of schedule. The eight expected times add up to 54.67 days of work, but the expected schedule is 33.67 days because content, the donation form, and training run in parallel with the build. That gap is the practical argument for drawing the network instead of listing tasks.
Path spread. Adding the variances along path 1 gives 1.00 + 2.78 + 5.44 + 0.69 + 0.25 ≈ 10.17 (the terms shown are rounded; the exact sum is 61/6), so the path's standard deviation is √10.17 ≈ 3.19 days. Read that as "the longest path could plausibly land several days either side of 33.67," not as a promise about any particular week.
What the example does and does not tell you
It tells you which activities deserve the closest attention (B, D, F), where there is room to absorb delay (C, E, G), and roughly how wide the uncertainty is. It does not tell you whether the developer is also assigned to the donation form, whether the accessibility reviewer is available in the week the build finishes, or what happens if the vendor never answers. Those are resource and risk questions the chart cannot answer on its own.
Copyable PERT chart template
The template below is plain text so you can paste it into any document, spreadsheet, or whiteboard note. There is no file to download; the tables are the template.
1. Activity register (fill one row per activity)
| ID | Activity (verb + deliverable) | Done means | Predecessors | Owner | O | M | P | TE | σ | Notes / basis of estimate |
|---|---|---|---|---|---|---|---|---|---|---|
| A | — | |||||||||
| B | ||||||||||
| C | ||||||||||
| D | ||||||||||
| E | ||||||||||
| F | ||||||||||
| G | ||||||||||
| H |
2. Path register (one row per start-to-finish route)
| Path | Activities in order | Sum of TE | Slack vs. longest path | Notes |
|---|---|---|---|---|
| 1 | ||||
| 2 | ||||
| 3 |
3. Node card (copy once per activity onto the diagram)
[ID] Activity name
TE = __ days  (O __ · M __ · P __)
Predecessors: __    Owner: __
Slack: __ days       On longest path: yes / no
4. Assumptions and review log
| Date | Change | Which estimates or dependencies moved | New longest path | Reviewed by |
|---|---|---|---|---|
Fill the activity register first, compute TE and σ for every row, draw the diagram from the predecessor column, and only then enumerate paths. Doing it in that order means the diagram never contains a dependency that is not written down.
How to make a PERT chart in seven steps
- List the activities and define "done" for each. Keep them at a level where one person can own each one and give a duration estimate they believe. If you are starting from a planning-phase document, the deliverables list from a project planning phase is a good source.
- Record predecessors. For each activity, write down which activities must finish first. Ask "what do I need in hand to start this?" rather than "what usually happens before this?" The second question adds false dependencies.
- Collect three estimates from the people doing the work. Ask for O, M, and P separately and write down the reasoning behind P. A pessimistic estimate with a named cause ("vendor turnaround has run to three weeks") is auditable; one without a cause is padding.
- Compute TE and σ for every activity. Use TE = (O + 4M + P) / 6 and σ = (P − O) / 6. Show the arithmetic in the register so a reviewer can redo it.
- Draw the network left to right. Start node, activities as boxes, arrows from each predecessor, milestone at the end. Avoid crossing arrows where possible and never draw a loop; a network with a cycle has no start-to-finish path.
- Enumerate every path and add the expected times. Mark the longest expected path and compute slack for the rest. In a small network you can do this by hand; in a larger one, list paths in the path register and check that every activity appears in at least one.
- Record assumptions and schedule the review. Write down what would change the estimates (a new vendor, a scope addition, a staffing change) and when the chart will be re-checked. A PERT chart that was accurate at kickoff and never updated is a historical document, not a plan.
Update and review checklist
- Every activity has an owner, three estimates, and a written basis for the pessimistic value.
- Every arrow corresponds to a row in the predecessor column, and vice versa.
- The network has no cycles and every activity lies on at least one start-to-finish path.
- Path totals were recomputed after the last estimate change, and the longest expected path is marked.
- Activities with small slack (a day or two) are flagged as near-critical.
- Known risks that could stretch a pessimistic estimate are logged somewhere the team reviews, such as a RAID log.
- The review date and the person responsible for the next update are written on the chart.
PERT chart vs. Gantt chart, CPM, dependency map, and task list
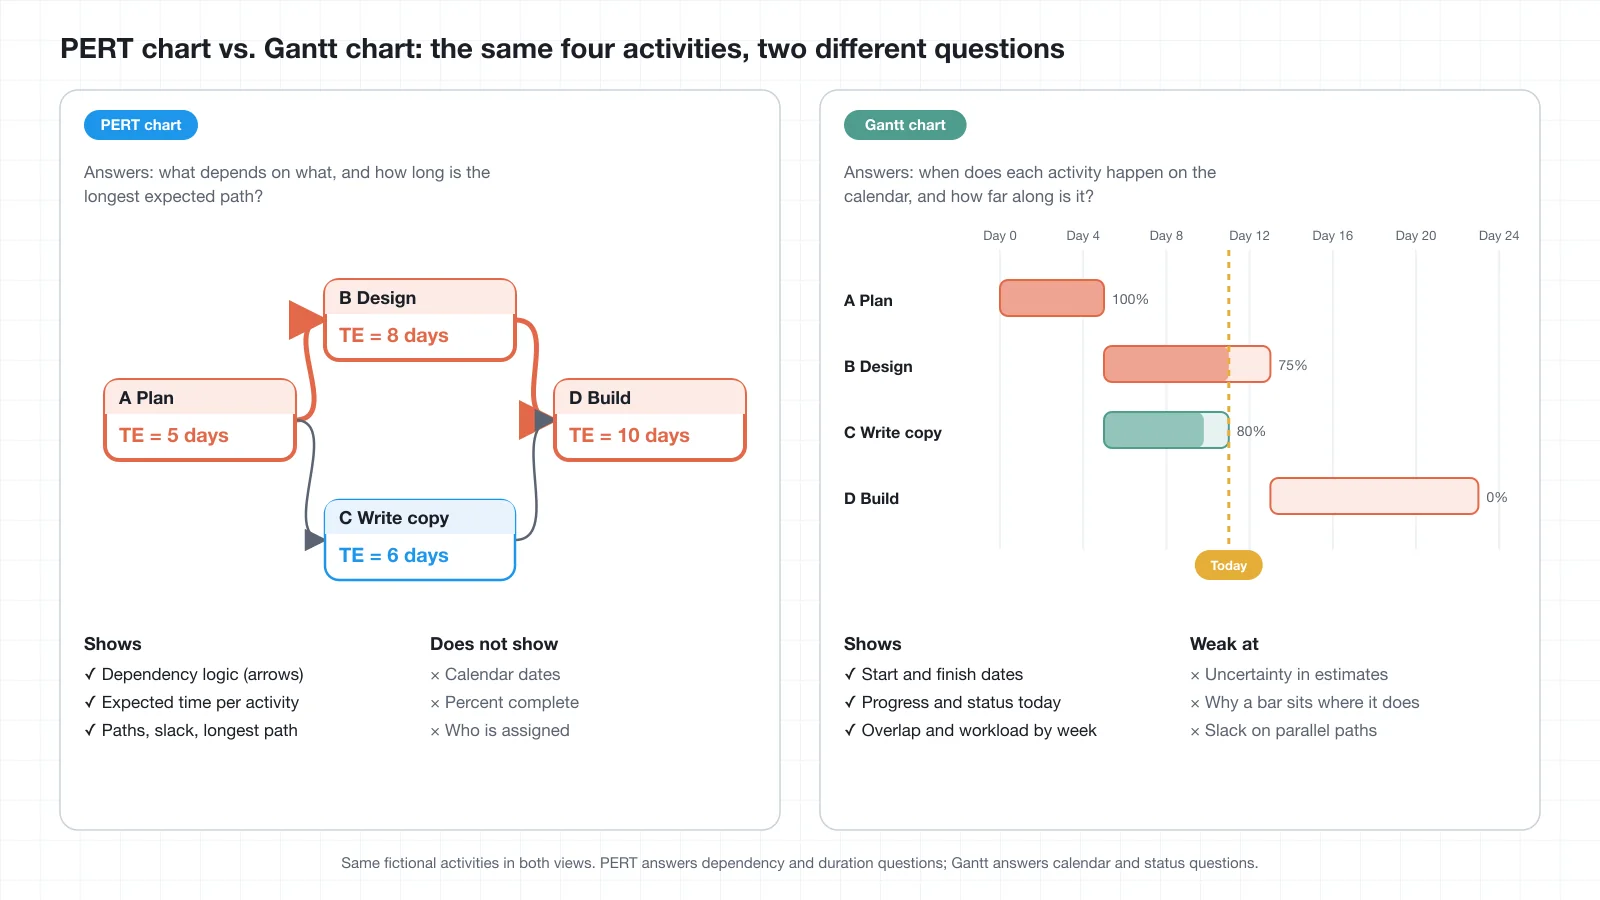
The most common comparison is PERT chart vs. Gantt chart. A Gantt chart is a bar chart on a time axis: one row per activity, bar length equals duration, bar position equals start and finish dates. GAO notes that reviewing the sequence of critical activities in a Gantt chart is an easy way to check whether a calculated critical path is practical, which is a good description of the Gantt chart's strength: it makes the calendar consequences of a network visible (GAO-16-89G). If you want the full walkthrough of that format, see the AFFiNE guides to the Gantt chart, a set of Gantt chart examples, and a Gantt chart template.
| View | What it shows best | Use it when | Poor fit when |
|---|---|---|---|
| PERT chart | Dependency logic, expected durations from three estimates, paths and slack | Durations are uncertain and you need the longest expected path before committing to dates | The plan changes daily, or the audience only needs dates and status |
| Gantt chart | Calendar position, duration bars, progress, overlap by week | Communicating a schedule, tracking status against dates, spotting overloaded weeks | You need to reason about uncertainty or see why a bar sits where it does |
| CPM network | The same network as PERT with single fixed durations and an exact critical path | Durations are known from repeated experience (construction, manufacturing) | Estimates are guesses; a single number hides the range |
| Dependency map | Which items block which, without durations | Untangling blockers across teams, early planning before estimates exist | You need any statement about how long the work takes |
| Task list | Ownership and completion of individual items | Day-to-day execution of a settled plan | You need to see sequence, parallelism, or the finish date |
In practice the views are used together: a PERT network to decide the logic and expected durations, a Gantt chart to put the result on a calendar and report progress, and a task list to run the week.
Common PERT chart mistakes
- Estimating alone. The person drawing the chart supplies all three numbers. Estimates should come from whoever will do the work, with the reasoning captured.
- Pessimistic means catastrophic. If P is "everything fails," TE is inflated and the chart loses credibility. P should reflect problems the team has actually seen.
- Optimistic equals most likely. When O and M are the same number, the estimator has not thought about the upside, and σ is understated.
- Missing or false dependencies. A missing arrow makes a path look shorter than it is; an unnecessary arrow serializes work that could run in parallel.
- Confusing the sum of work with the length of the schedule. In the example, 54.67 days of work fits in a 33.67-day schedule. Reporting the first number as the timeline is a common error.
- Treating the longest expected path as fixed. After every estimate change, total the paths again. A path with 2 days of slack today can be the longest path next week.
- Never updating. A chart drawn at kickoff and not revised is not a plan anyone should schedule against.
Limitations: estimates, resources, and execution
A PERT chart is a structured way to write down what a team believes about durations and dependencies. Its outputs inherit every weakness of those beliefs.
- Expected times depend on subjective estimates. Three numbers from an optimistic estimator are still optimistic. The formula does not correct bias; it only combines what it is given.
- The classic formula is a convention, not a law. The beta assumption and the 4-to-1 weighting are simplifying conventions; they are useful for planning, not a guarantee of any date.
- The longest expected path is not a probabilistic completion guarantee. Because paths converge and estimates have spread, the project can finish later than the longest expected path more often than a single-path calculation suggests. GAO's guidance treats three-point estimates as inputs to simulation for that reason (GAO-16-89G).
- Dependencies and resources change. The network assumes finish-to-start logic and unlimited resources. If the same developer owns activities D and E, they cannot run in parallel no matter what the arrows say. GAO's Best Practice 3, assigning resources to all activities, exists for exactly this reason (GAO-16-89G).
- A diagram does not manage execution. The chart identifies where attention belongs. Someone still has to check progress, escalate slips on the longest path, and revise estimates when reality arrives.
Accessibility and readability guidance
- Do not rely on color alone. The examples above mark the longest expected path in red and with thicker lines; the path register repeats the information as text. A reader with color-vision deficiency or a screen reader gets the same answer.
- Publish a text equivalent. The activity and path registers are the accessible version of the diagram. Put them next to the image, not in an appendix.
- Write alt text that states the conclusion. "PERT chart of eight activities; longest expected path A, B, D, F, H at 33.67 days" is more useful than "PERT chart diagram."
- Keep the network readable. Left-to-right flow, one convention (activity-on-node or activity-on-arrow), no crossing arrows where avoidable, and few enough nodes that every label stays legible at normal zoom. Larger projects should be split into sub-networks with a milestone at each boundary.
- Label units. State whether estimates are working days, calendar days, or weeks, in the diagram and in the register.
Keep estimates, diagram, and decisions together in AFFiNE
AFFiNE is a docs-and-whiteboard workspace, not a PERT engine. It does not calculate expected times, run Monte Carlo simulations, level resources, or identify a critical path automatically. What it does support is keeping the pieces of a PERT exercise in one place, maintained by hand:
- Edgeless (whiteboard) mode for the network itself: shapes for activity nodes, connectors for dependency arrows, a diamond for milestones, and a color plus line weight for the longest expected path.
- Page mode for the activity register, the path register, and the assumptions log as tables, with the arithmetic written out where a reviewer can check it.
- Notes and links beside the diagram for the basis of each pessimistic estimate, the review date, and links to sources such as the GAO guide or your own RAID log.
Every number in that workspace is entered and recomputed by a person. If you would like to try the layout, you can rebuild the network and the register tables above in the AFFiNE whiteboard and its document pages.
Frequently asked questions
What is a PERT chart used for?
A PERT chart is used to plan projects whose activity durations are uncertain. It maps activities and their dependencies as a network, assigns each activity an expected time from optimistic, most likely, and pessimistic estimates, and identifies the longest expected path, which sets the earliest expected finish and shows where slips matter most.
What is the PERT formula for expected time?
The PERT expected time is TE = (O + 4M + P) / 6, where O is the optimistic estimate, M the most likely, and P the pessimistic. For O = 3, M = 5, P = 9 days, TE = 32 / 6 = 5.33 days. The standard deviation is (P − O) / 6, which is 1.00 day for the same activity.
What is the difference between a PERT chart and a Gantt chart?
A PERT chart is a network diagram that shows dependency logic and expected durations built from three estimates, so it answers what depends on what and which path is longest. A Gantt chart is a bar chart on a calendar that shows when each activity starts and ends and how complete it is. Teams typically plan the logic in a PERT network and communicate dates in a Gantt chart.
Is the longest expected path the same as the critical path?
They use the same longest-path logic, but the critical path comes from the critical path method, which uses single fixed durations. A PERT chart applies that logic to expected durations, so its result is a longest expected path. Because estimates have spread and parallel paths converge, a different path can end up delaying the finish, which is why the two terms are best kept distinct.
Can I use a PERT chart template without special software?
Yes. A PERT chart needs an activity register (ID, activity, predecessors, three estimates, expected time), a path register, and a drawing of the network. All three can live in a spreadsheet, a document with tables, or a whiteboard. Software is convenient for large networks, but the calculations in this article are done by hand and can be checked by hand.
Conclusion
A PERT chart earns its place when durations are uncertain and dependencies decide the finish. The method is small: three estimates per activity, TE = (O + 4M + P) / 6, a network of finish-to-start arrows, and a sum along every path to find the longest. The fictional relaunch above shows the payoff, 54.67 days of work fitting an expected 33.67-day schedule, and the caveats, including a 3.19-day spread on the longest path and slack figures that change the moment an estimate does. Keep the registers next to the diagram, write down the basis for every pessimistic number, and total the paths again whenever anything moves.
Sources
- U.S. Government Accountability Office, Schedule Assessment Guide: Best Practices for Project Schedules, GAO-16-89G, December 2015. Definitions of critical path and total float (Best Practices 6 and 7), Gantt chart use in critical path review, and three-point duration estimates in schedule risk analysis (Best Practice 8). gao.gov/products/gao-16-89g
- D. G. Malcolm, J. H. Roseboom, C. E. Clark, and W. Fazar, "Application of a Technique for Research and Development Program Evaluation," Operations Research 7(5), 646–669, 1959. Origin of PERT for the Polaris Fleet Ballistic Missile program and the probabilistic three-estimate approach. doi.org/10.1287/opre.7.5.646
- MIT OpenCourseWare, ESD.36 System Project Management, Lecture 9 "Probabilistic Scheduling" (de Weck and Lyneis, Fall 2012). Definitions of A/M/B estimates, the expected-time and variance formulas, the beta assumption, activity-on-arc origin, and PERT as CPM with probabilistic task times. ocw.mit.edu
- Washington State University, Engineering and Technology Management, "The Power of PERT," September 15, 2023. The expected-time formula, definitions of the three estimates, and stated limitations. etm.wsu.edu
About this article
Author and method. Written by the AFFiNE team. The definitions of critical path, float, and three-point estimates were checked against the GAO guide and MIT course notes linked above, and the origin claims against the 1959 Operations Research record. The nonprofit example is fictional; every expected time, path total, slack figure, and standard deviation was calculated by hand from the stated O, M, and P values and can be reproduced from the tables. No customer project, survey, or product benchmark is involved.
Commercial relationship. AFFiNE publishes this guide and makes the workspace mentioned in the AFFiNE section. That section describes manual use of existing document and whiteboard features only; it does not claim PERT, scheduling, or simulation capabilities.
Last reviewed: September 4, 2026.
Recommended review: a practicing project scheduler should verify the terminology, the CPM-versus-PERT distinction, and the example arithmetic before publication.
Related Articles

Master Project Timelines: Your Ultimate Gantt Chart Resource
Unlock Project Clarity: Mastering Gantt Chart Example Use

Gantt Chart Templates for 2026: Excel, Sheets & PowerPoint
Project Planning Phase Deliverables: Copy-Ready Templates Inside