What Is a Gantt Chart? Definition, Elements & Examples
A Gantt chart is a bar chart of a project schedule. Tasks are listed down the left side, time runs across the top, and each task is a horizontal bar that runs from its start date to its finish date. Diamonds mark milestones and arrows mark dependencies, so you can see what happens when, what overlaps and what has to wait.
This guide explains how to read a Gantt chart, what each element and marker means, and how dependencies and the critical path work. It then walks through three worked examples. The examples are fictional teaching projects, and their schedule math was recalculated on November 4, 2026. AFFiNE publishes this blog. AFFiNE does not have a Gantt chart view today; Where AFFiNE fits explains what it does and doesn't do.
Downloads:
- Gantt chart examples workbook (Excel, opens in Google Sheets): the kitchen renovation with live critical path formulas, plus the campaign and release plans
- CSV files: kitchen renovation schedule and marketing campaign schedule
- Need a blank template instead? Use the free Gantt chart template for Excel, Google Sheets and PowerPoint.
What is a Gantt chart?
A Gantt chart answers four questions about a project on one page:
- What work is there? One row per task.
- When does each task happen? The position of its bar.
- How long does it take? The length of its bar.
- What has to wait for what? The arrows between bars.
In one sentence, the Gantt chart meaning is: a project schedule drawn as bars on a calendar. The Project Management Institute's glossary, as quoted in Wikipedia's Gantt chart article, describes it the same way: activities on the vertical axis, dates on the horizontal axis, and durations shown as horizontal bars placed by their start and finish dates.
The chart is named after Henry L. Gantt, an American engineer who designed and popularized it around 1910 to 1915. Today it is the default schedule view in most project management software, and you can build one in a spreadsheet.
A Gantt chart fits best when a project has a fixed end date, tasks that hand off to each other, and more than one person doing the work. Construction, events, product launches, office moves and software releases are typical. It fits poorly for continuous work with no end date, such as a support queue. A Kanban board handles that better.
How to read a Gantt chart
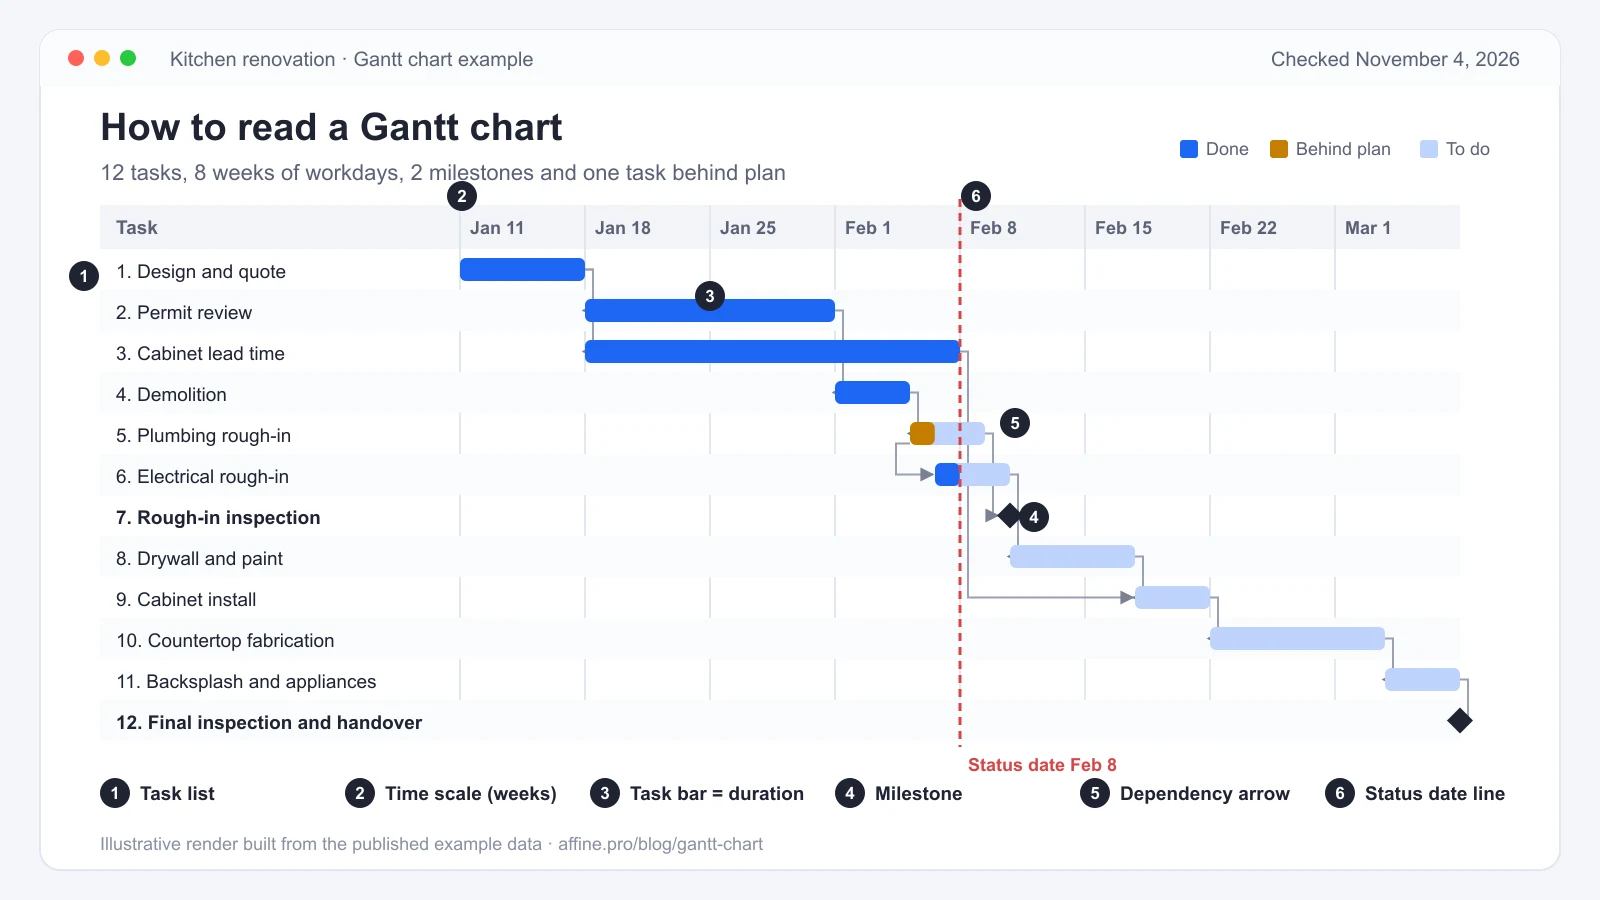
Read a Gantt chart in this order:
- Start with the time scale. The header shows the unit. In the example, each column is one work week that starts on the date shown. Weekends are skipped.
- Scan the task list. Each row is one task, numbered so dependencies can refer to it. Bold rows with a diamond instead of a bar are milestones.
- Read each bar's position and length. Where a bar starts is the task's start date, and its length is the duration. Permit review takes 10 workdays, from Jan 18 to Jan 29.
- Follow the arrows. An arrow from one bar to another means the second task waits for the first. Demolition can't start until the permit review is done.
- Find the status line. The dashed vertical line marks the date the chart reports on, here Feb 8. Work to the left of the line should be done.
- Compare progress with the status line. The dark fill inside a bar shows how much is done. Plumbing rough-in is 33% done but should be 67% done by Feb 8, so it is one workday behind plan. Plumbing is on the critical path (explained below), so that one-day slip moves the handover unless the team catches up.
Gantt chart elements and markers
| Element | What it shows | How it is drawn |
|---|---|---|
| Task list | The work, one row per task, often grouped by phase | Left-hand column |
| Time scale | Days, weeks or months across the top | Header row |
| Task bar | When a task starts and finishes; length is its duration | Horizontal bar |
| Milestone | A zero-length checkpoint such as an approval or launch | Diamond |
| Dependency | A task that has to wait for another | Arrow between bars |
| Progress | How much of a task is done | Shaded part of the bar or a % |
| Status (today) line | The date the chart reports on | Vertical line |
| Owner | Who is responsible for the task | Column or bar label |
| Summary bar | A phase that spans its child tasks | Thick or bracketed bar |
| Baseline | The original plan, to compare against the current one | Thin bar under the task bar |
| Critical path | Tasks with zero float that set the finish date | Highlighted bars, often red |
Not every chart needs all eleven. The minimum is a task list, a time scale and bars. Add milestones, dependencies and a status line as soon as more than one person relies on the chart. Baselines and critical path highlighting usually come from scheduling software, because they are hard to keep current by hand.
Gantt chart markers and symbols. Conventions vary a little between tools, but most use the same set:
- Diamond (◆): a milestone.
- Arrow: a dependency, pointing from the controlling task to the task that waits.
- Dashed or colored vertical line: today or the status date.
- Shaded fill inside a bar: percent complete.
- Red bar or outline: a task on the critical path.
- Bracket or thick bar: a summary task or phase.
- Thin gray bar under a task: the baseline, or original plan.
Milestones in a Gantt chart
A milestone is a checkpoint with zero duration: an approval, an inspection, a delivery or a launch. It is drawn as a diamond on the date it happens and takes no time itself. In the kitchen example, the rough-in inspection on Feb 9 and the final handover on Mar 5 are milestones.
Good milestones have three things in common:
- A yes or no test. "Inspection passed" is a milestone. "Plumbing mostly done" is not.
- Often, an owner outside the task. Approvals and inspections are usually done by someone who isn't doing the work, which is exactly why they need their own row.
- Something waits on them. If nothing depends on a milestone, it is a date to remember, not a point that controls the schedule.
Aim for about one milestone per phase. If every other row is a diamond, the chart stops telling readers which dates matter.
Task dependencies: FS, SS, FF and SF
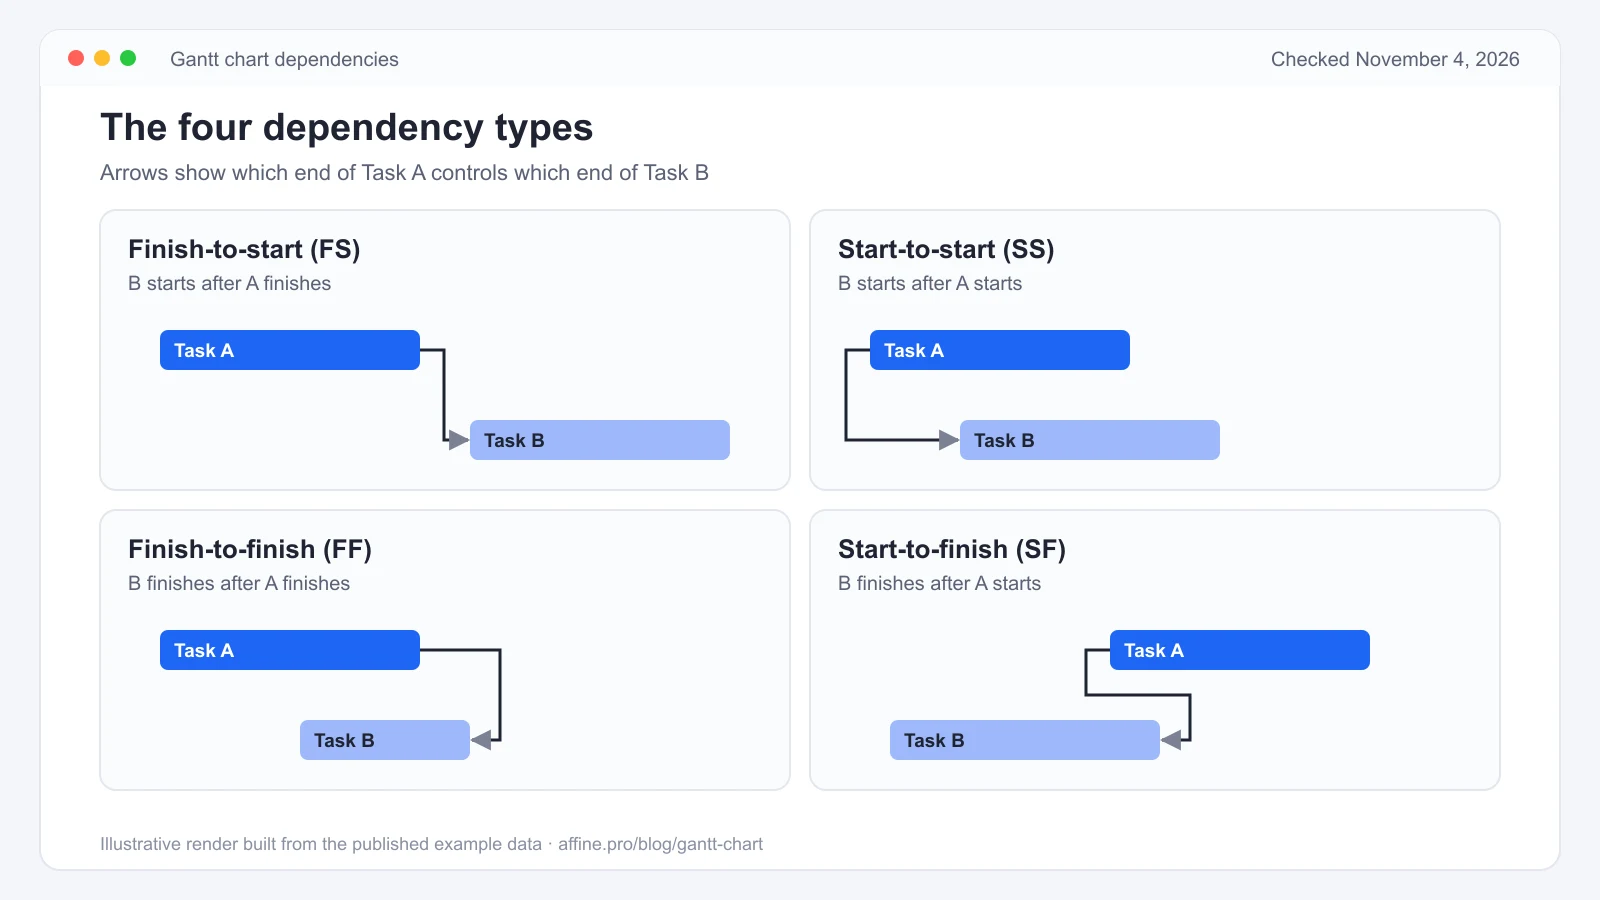
A dependency says which end of one task controls which end of another. There are four types:
| Type | Rule | Example | When to use it |
|---|---|---|---|
| Finish-to-start (FS) | B starts after A finishes | Pour the foundation, then frame the walls | Most common; default in most tools |
| Start-to-start (SS) | B starts after A starts | Electrical rough-in starts one day after plumbing starts | Overlapping work; often with a lag |
| Finish-to-finish (FF) | B finishes after A finishes | Testing finishes after development finishes | Work that wraps up together |
| Start-to-finish (SF) | B finishes after A starts | The old system runs until the new one goes live | Rare; handovers and shift cover |
Two more terms come with dependencies:
- Lag is a deliberate wait. "SS +1" in the kitchen example means electrical rough-in starts one workday after plumbing starts, so the two trades aren't in the same spot on day one.
- Lead is the opposite: a negative lag that lets a task start before its predecessor finishes.
Most links in a typical schedule are finish-to-start. Use the other types only when the overlap is real, because every extra link type makes the chart harder to read.
Critical path and float
The critical path is the longest chain of dependent tasks from start to finish. It sets the earliest date the project can finish, and any delay on it delays the finish by the same amount. Float, also called slack, is how long a task off the critical path can slip before it moves the finish date.
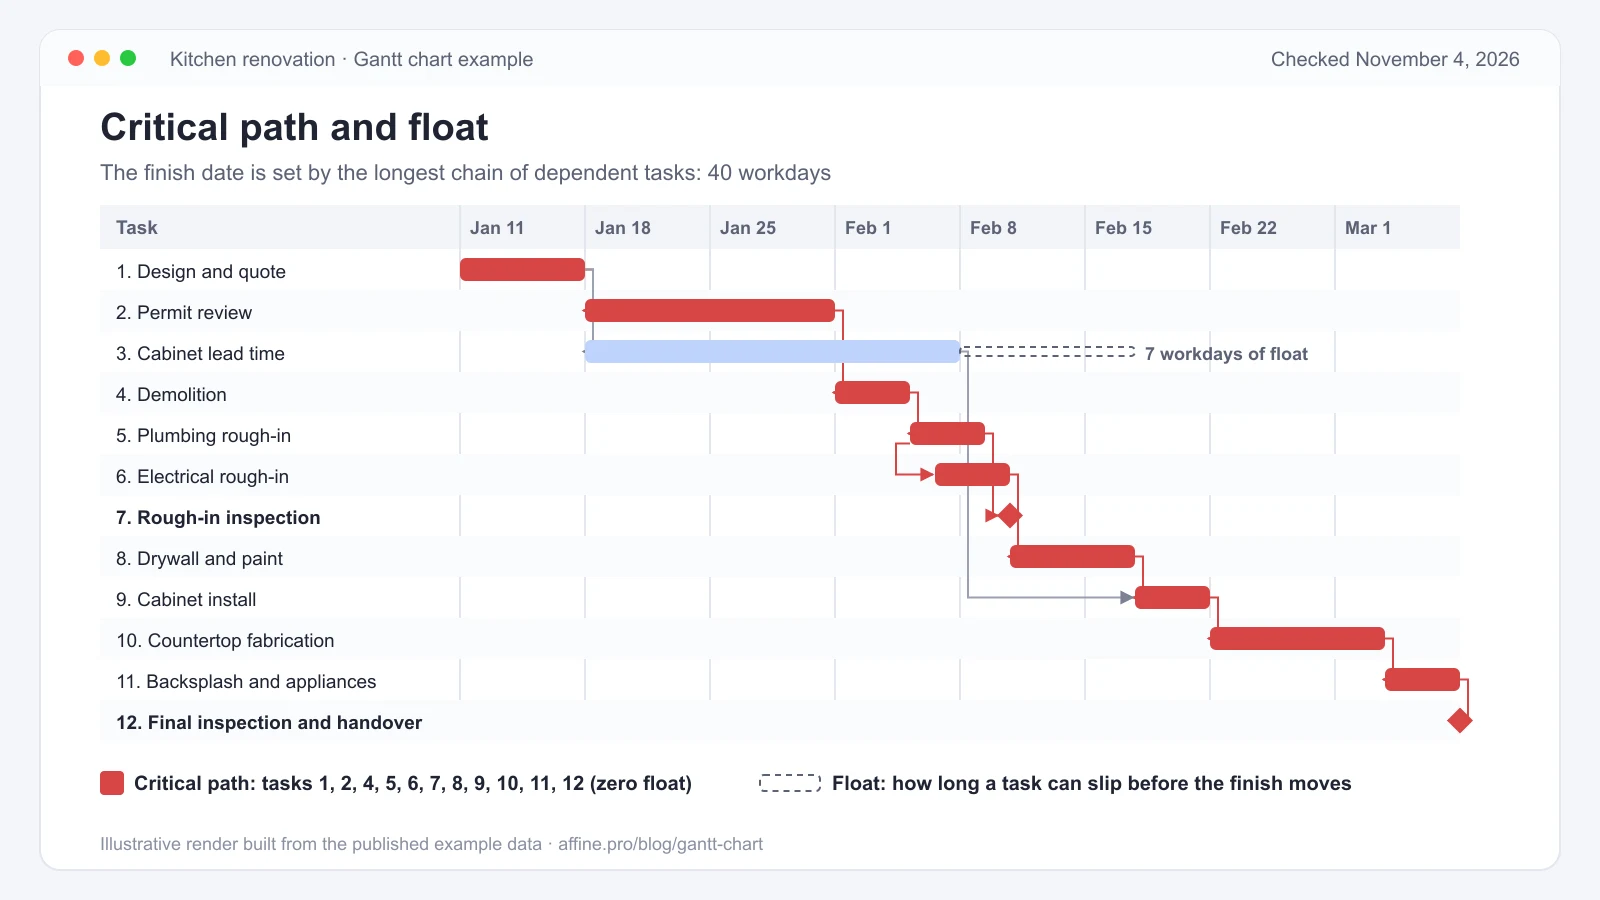
In the kitchen example, the critical path runs through tasks 1, 2, 4, 5, 6, 7, 8, 9, 10, 11 and 12. It takes 40 workdays, from Jan 11 to Mar 5, 2027. Only one task has float: the cabinet lead time. The cabinets arrive on Feb 5, but cabinet install can't start before Feb 17, so the order can slip 7 workdays without moving the handover. If it slips 8, it becomes the task that sets the finish date.
This is why the critical path matters more than the length of any single bar. The 15-day cabinet order is the longest bar on the chart, but it doesn't drive the finish date. The 10-day permit review does.
How it is calculated. Scheduling software runs two passes. The forward pass sets each task's early start to the latest finish of the tasks it depends on. The backward pass starts from the project finish and sets each task's late finish to the earliest late start of the tasks that depend on it. Float is late start minus early start, and the tasks with zero float form the critical path. PMI has a full walkthrough of these critical path method calculations. The example workbook does the same with formulas, so the float and critical flags update when you change a duration.
One caveat: a classic hand-drawn Gantt chart doesn't show the critical path or slack, a limitation PMI points out in its history of the harmonogram. You need dependency links and a calculation. That is why the critical path method was developed as a separate technique in the late 1950s.
Gantt chart example: kitchen renovation
Here is the full schedule behind the charts above: a 12-task, 8-week plan for a fictional kitchen renovation. Durations are in workdays. Weekends are excluded, and no public holidays are included.
| Task | Workdays | Depends on | Dates (2027) | Float |
|---|---|---|---|---|
| 1. Design and quote | 5 | None | Jan 11 - Jan 15 | 0 (critical) |
| 2. Permit review | 10 | 1 (FS) | Jan 18 - Jan 29 | 0 (critical) |
| 3. Cabinet lead time | 15 | 1 (FS) | Jan 18 - Feb 5 | 7 workdays |
| 4. Demolition | 3 | 2 (FS) | Feb 1 - Feb 3 | 0 (critical) |
| 5. Plumbing rough-in | 3 | 4 (FS) | Feb 4 - Feb 8 | 0 (critical) |
| 6. Electrical rough-in | 3 | 5 (SS +1) | Feb 5 - Feb 9 | 0 (critical) |
| 7. ◆ Rough-in inspection | 0 | 5 (FS), 6 (FS) | Feb 9 (milestone) | 0 (critical) |
| 8. Drywall and paint | 5 | 7 (FS) | Feb 10 - Feb 16 | 0 (critical) |
| 9. Cabinet install | 3 | 8 (FS), 3 (FS) | Feb 17 - Feb 19 | 0 (critical) |
| 10. Countertop fabrication | 7 | 9 (FS) | Feb 22 - Mar 2 | 0 (critical) |
| 11. Backsplash and appliances | 3 | 10 (FS) | Mar 3 - Mar 5 | 0 (critical) |
| 12. ◆ Final inspection and handover | 0 | 11 (FS) | Mar 5 (milestone) | 0 (critical) |
What this example teaches:
- Waiting is a task too. Nobody is on site during permit review or cabinet lead time, but both have owners and durations. Leaving waits out is a common reason renovation schedules look shorter than they turn out.
- Parallel paths meet at a merge point. Cabinet install waits for two things, drywall and paint and the cabinet delivery. Whichever finishes later controls its start.
- Inspections are milestones with outside owners. The plan can't move past Feb 9 until the inspector signs off.
The workbook's Kitchen renovation tab has the same tasks with live formulas. Change a duration or a lag, and the dates, float and critical flags recalculate.
More Gantt chart examples
Marketing campaign
A launch campaign suits a Gantt chart because several teams work in parallel toward one fixed date.
| Task | When | Depends on | Owner |
|---|---|---|---|
| Brief and audience research | Week 1 | None | Marketing lead |
| Messaging and creative concept | Weeks 2-3 | Brief (FS) | Content + design |
| ◆ Concept approved | Start of week 4 | Concept (FS) | Head of marketing |
| Landing page build | Weeks 4-5 | Approval (FS) | Web team |
| Ad creative and copy | Weeks 4-5 | Approval (FS) | Design |
| Email sequence | Weeks 5-6 | Landing page (SS +1 week) | Lifecycle |
| ◆ Launch | Start of week 7 | Page, ads, email (FS) | Marketing lead |
| Paid and email campaign live | Weeks 7-8 | Launch (FS) | Growth |
| Results review | Week 9 | Campaign (FS) | Marketing lead |
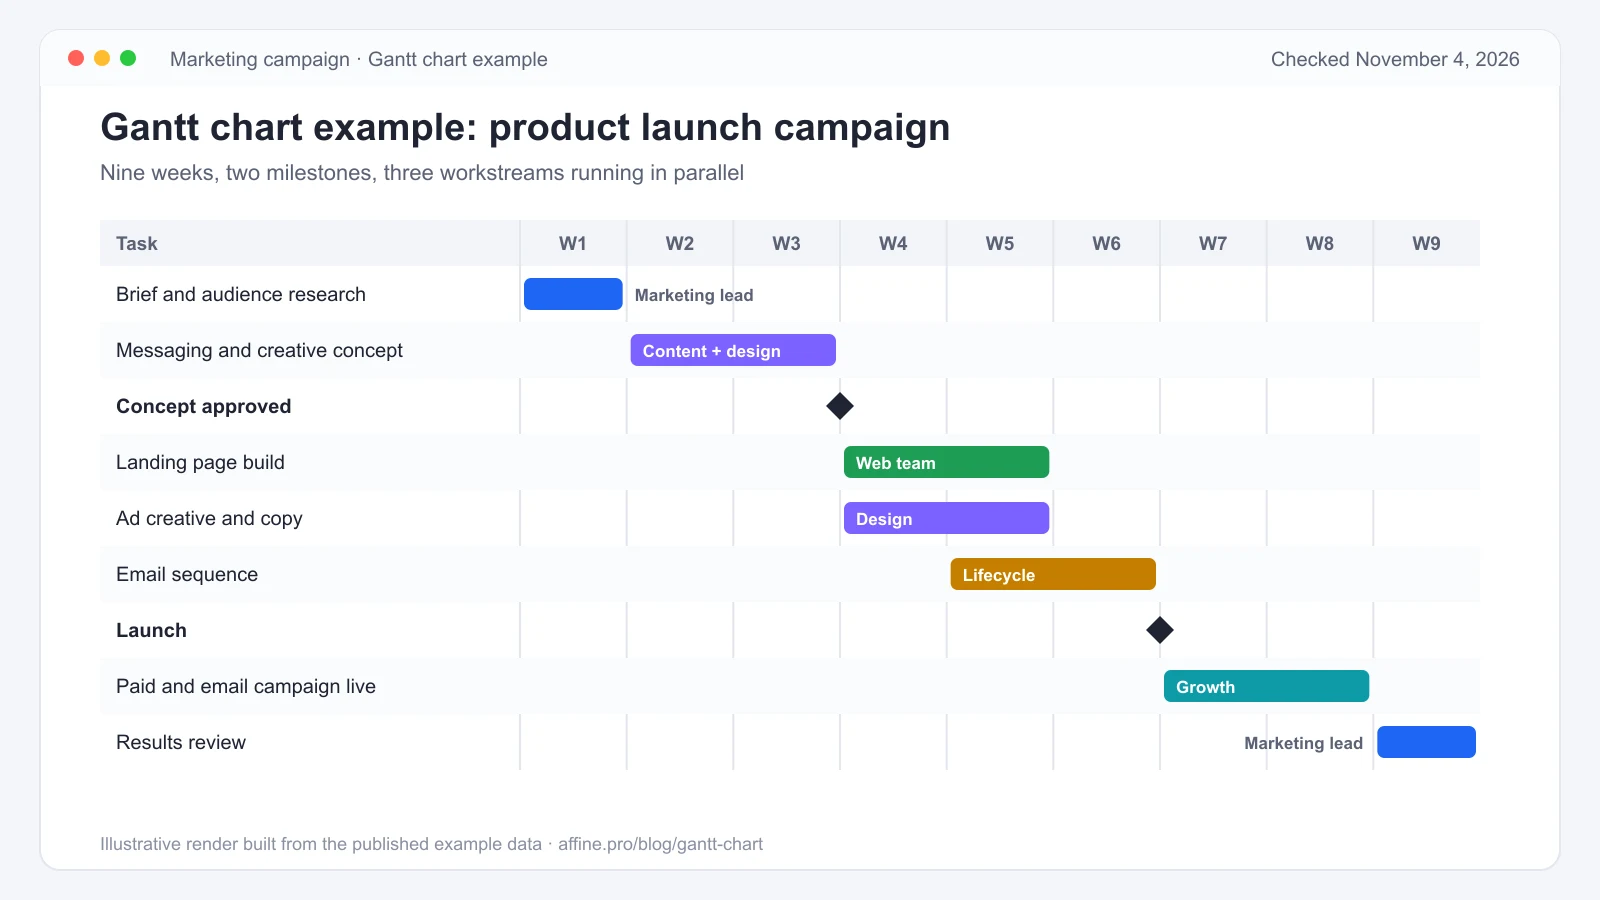
Research and the creative concept run in sequence. Approval at the start of week 4 then releases three workstreams at once. The email sequence starts a week after the landing page (SS +1 week) because the emails link to it, and the launch waits for the page, the ads and the emails. Coloring bars by owner makes busy stretches easy to spot: design work runs from week 2 through week 5.
Software release
Agile teams often assume Gantt charts don't fit sprints. They do, one level up. Keep tickets on the sprint board, and use the Gantt chart for sprints, parallel workstreams and fixed dates.
| Workstream | When | Depends on | Note |
|---|---|---|---|
| Sprint 1: data model and API | Weeks 1-2 | None | Backlog items live on the sprint board |
| Sprint 2: core screens | Weeks 3-4 | Sprint 1 (FS) | Bar shows the sprint, not each ticket |
| Sprint 3: integrations | Weeks 5-6 | Sprint 2 (FS) | Scope can move between sprints |
| Docs and help center | Weeks 4-7 | Sprint 2 (SS) | Runs in parallel with build work |
| ◆ Code freeze | End of week 6 | Sprint 3 (FS) | Fixed date the whole team plans around |
| Beta and bug fixing | Weeks 7-8 | Code freeze (FS) | Feeds bugs back into the backlog |
| ◆ Public release | End of week 8 | Beta (FS), Docs (FS) | Milestone shared with sales and support |
Here the milestones carry most of the value. Sales, support and marketing don't need ticket detail. They need to know when code freeze and release happen, and what depends on them.
Gantt chart vs PERT chart, Kanban board, timeline and roadmap
| Chart | What it shows | Best for | Weak at |
|---|---|---|---|
| Gantt chart | Tasks as bars on a calendar, with dependencies | Projects with dates, handoffs and a deadline | Fast-changing scope; looks precise even when it is not |
| PERT chart | Tasks as a network of nodes and arrows | Estimating duration under uncertainty | Reading dates at a glance |
| Kanban board | Work items moving through stage columns | Continuous flow such as support or content | Deadlines and dependencies |
| Timeline | Key dates and milestones on one line | Briefing stakeholders on the big moments | Showing overlap, owners and knock-on effects |
| Roadmap | Themes or goals by month or quarter | Strategy and direction over 6 to 18 months | Day-to-day scheduling |
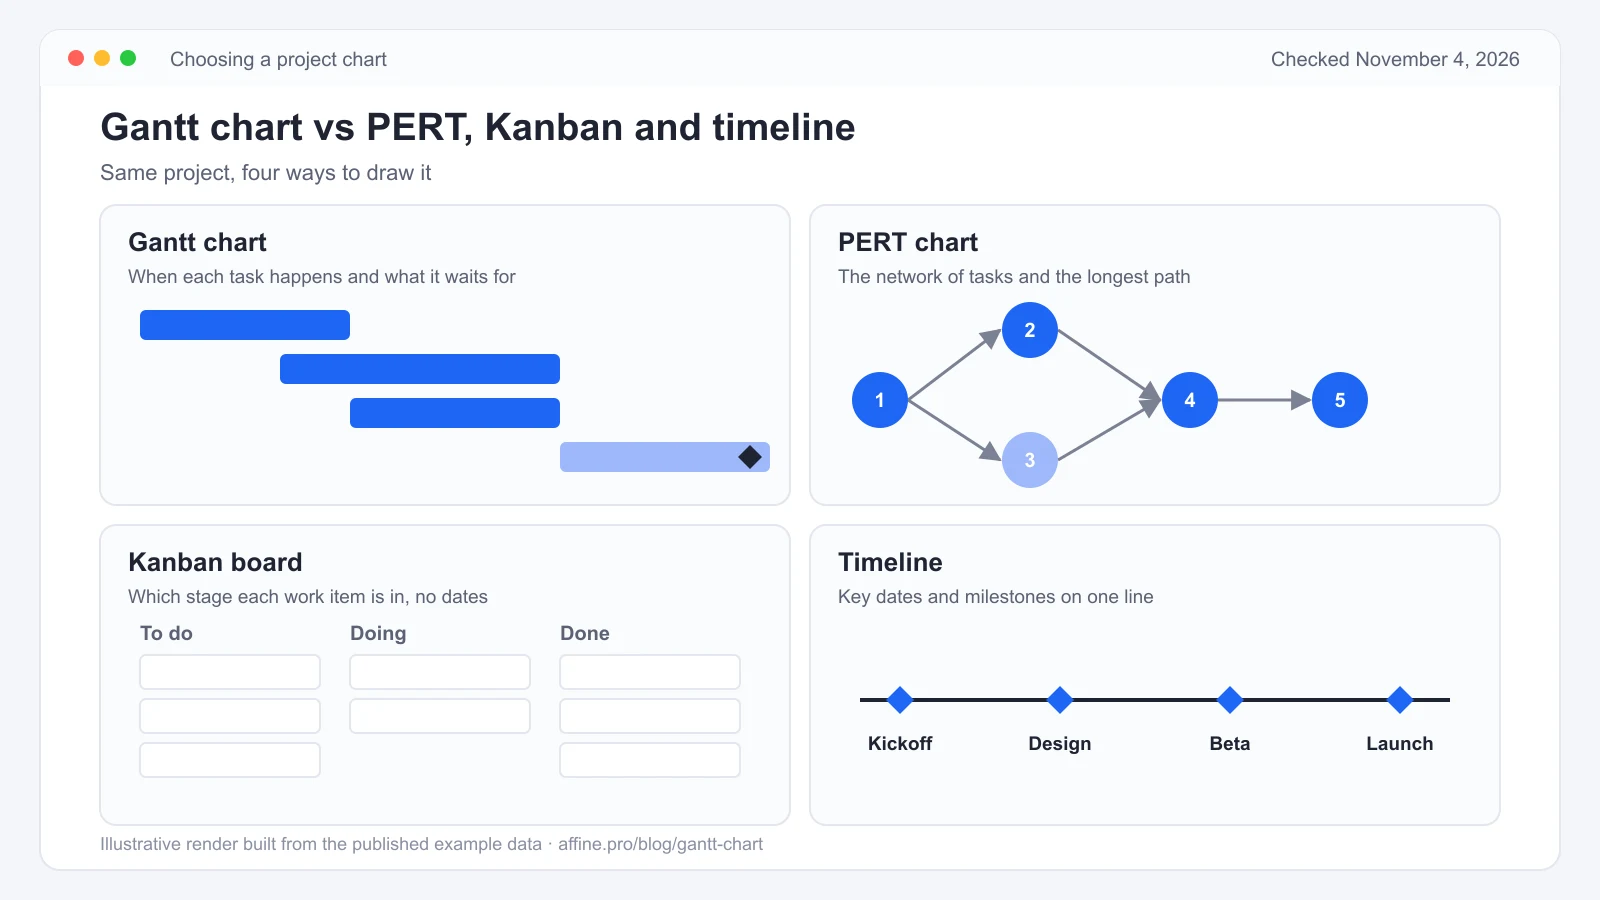
- Gantt chart vs PERT chart: a PERT chart draws the same dependencies as a network and uses optimistic, most likely and pessimistic estimates for each task. Many teams estimate with PERT and share the plan as a Gantt chart. Our PERT chart guide covers the formula and a side-by-side example.
- Gantt chart vs Kanban board: Kanban shows flow, not dates. Use a Kanban board for ongoing work and a Gantt chart for a project with an end date. Many teams use both: the Gantt chart for the plan and the board for this week's tasks. To pick a board tool, compare free Kanban board software.
- Gantt chart vs timeline: a project timeline shows the key dates on one line. It reads better in a slide, but hides overlaps and dependencies. For a quick version in a shared doc, see how to make a timeline in Google Docs.
- Gantt chart vs roadmap: a project roadmap shows goals and themes by month or quarter. Turn a roadmap item into a Gantt chart once it has scope, owners and dates.
Advantages and disadvantages of Gantt charts
Advantages:
- One view of what happens when, who does it and what waits on what.
- Knock-on effects are visible: move one bar and you can see what moves with it.
- Stakeholders can read it without training.
- It works at any level of detail: tasks, phases or sprints.
Disadvantages:
- It looks more certain than it is. A bar hides the uncertainty in its estimate, which PERT handles better.
- It goes stale fast if nobody owns updates. A chart that is three weeks out of date misleads people.
- It gets hard to read past a few dozen rows. Split large plans by phase.
- It doesn't show effort. A short bar can still be a full-time job, so check workload separately.
How to make a Gantt chart
- List the deliverables and break them into tasks that take a few days to two weeks each.
- Estimate each duration in workdays, and add waiting time such as approvals and lead times as tasks.
- Link the dependencies. Most will be finish-to-start.
- Add milestones for approvals, inspections and launch dates.
- Give each task one owner.
- Set a status date and update weekly. Owners update percent complete, and you check the critical path.
Where to build it:
- Excel or Google Sheets: the free Gantt chart template handles the date math with WORKDAY formulas and draws the bars with conditional formatting. It also includes a PowerPoint slide for one-page summaries.
- Gantt chart software: if you need drag-and-drop bars, automatic rescheduling and resource views, see how to choose a Gantt chart maker.
- Something other than a Gantt chart: if the work is ongoing or changes every week, compare these Gantt chart alternatives.
A short history of the Gantt chart
- 1896: Polish engineer Karol Adamiecki starts using a work-flow chart he calls the harmonogram. He presents it in 1903 but publishes a full description only in 1931, so it stays little known outside Poland.
- About 1910 to 1915: Henry L. Gantt designs and popularizes his bar chart for scheduling and tracking production work. His book Organizing for Work follows in 1919.
- 1922: Wallace Clark's book The Gantt Chart: A Working Tool of Management documents the method for managers.
- Late 1950s: Morgan R. Walker of DuPont and James E. Kelley Jr. of Remington Rand develop the critical path method, and PERT is developed at about the same time. Scheduling software later combines dependency networks with Gantt bars.
- Today: Gantt charts are the default schedule view in project management software, and spreadsheets can draw them with formulas.
Where AFFiNE fits
AFFiNE isn't a Gantt chart tool and doesn't draw Gantt bars. Its database documentation lists Table and Kanban views as available today, with Calendar and Timeline views planned. Where it helps is the work around the schedule: the project brief, decisions, meeting notes and a task table in one workspace, plus a whiteboard for sketching phases before you commit to dates. A practical setup is to plan dates in the example workbook or a Gantt tool, keep the brief and task table in AFFiNE, and link the two. You can start from the project timeline template.
Gantt chart FAQs
What is a Gantt chart in simple terms?
A Gantt chart is a project schedule drawn as bars on a calendar. Each row is a task, and each bar shows when that task starts, how long it takes and when it ends. Diamonds mark milestones, and arrows show which tasks have to wait for others.
What are the main elements of a Gantt chart?
The essential elements are a task list, a time scale and task bars. Most charts also show milestones, dependencies, progress, a status or today line, and task owners. Scheduling software adds summary bars, baselines and critical path highlighting.
What is a milestone in a Gantt chart?
A milestone is a checkpoint with zero duration, such as an approval, an inspection or a launch. It is drawn as a diamond on its date. Good milestones have a clear yes or no test and at least one task that waits on them.
What do the symbols on a Gantt chart mean?
A diamond is a milestone, an arrow is a dependency, a vertical line marks today or the status date, and shading inside a bar shows percent complete. Red bars usually mark the critical path, and a thin bar under a task shows the original baseline.
Can a Gantt chart show the critical path?
Yes, if the tasks are linked with dependencies. Scheduling software and the example workbook on this page calculate float for each task and highlight the zero-float chain that sets the finish date. A hand-drawn Gantt chart without dependency links can't show it.
What is the difference between a Gantt chart and a PERT chart?
A Gantt chart shows tasks as bars on a calendar, so dates and overlaps are easy to read. A PERT chart shows tasks as a network and uses three time estimates per task to handle uncertainty. Many teams estimate with PERT and share the plan as a Gantt chart.
Sources and verification
This guide was checked on November 4, 2026.
- Wikipedia: Gantt chart (definition, Henry Gantt c.1910-1915, Adamiecki 1896)
- PMI: The harmonogram, an overlooked method of scheduling work
- PMI: Critical path method calculations
- Wikipedia: Critical path method (Walker and Kelley, late 1950s)
- Library of Congress: Clark, The Gantt Chart (1922)
- AFFiNE Docs: Blocks with Databases
The kitchen renovation, campaign and software release are fictional teaching examples. The kitchen dates, float and critical path come from a forward and backward pass over the published durations and links, and the workbook formulas recalculate the same values.