Free Gantt Chart Templates: Excel, Sheets, PowerPoint, Word
What changed (Nov 14, 2026): Rebuilt the page as a template collection: 9 free Excel Gantt chart templates (simple, daily, weekly, monthly, multi-project, marketing, event, agile, construction) plus PowerPoint, Word and CSV versions, recalculated in LibreOffice and spot-checked in Apple Numbers; added a chooser table, Google Sheets and Mac instructions, compatibility and license notes, and 10 FAQs.
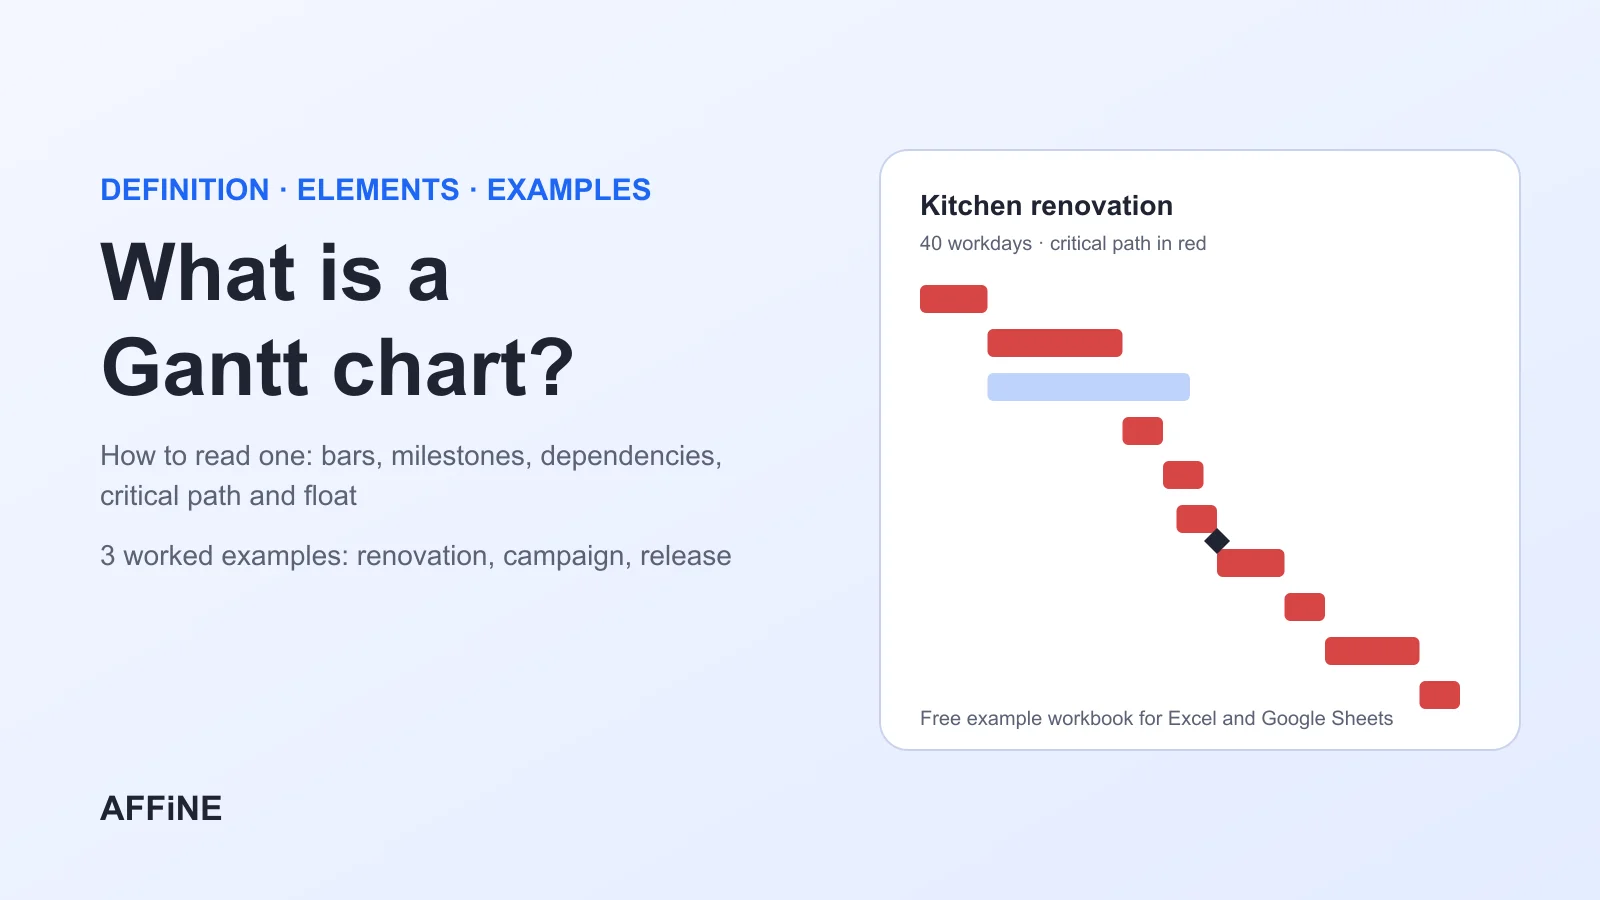
A Gantt chart template is a ready-made project schedule that lists tasks down the left side and draws each task as a horizontal bar across a date scale. A good one does more than color cells. It calculates end dates from durations, moves dependent tasks when an earlier task slips, marks milestones, and shows progress against a status date. If you're new to the format, start with what a Gantt chart is and how to read one. Below are nine free Excel and Google Sheets Gantt chart templates (simple, weekly, daily, monthly, multi-project, construction, marketing, agile, and event planning), plus an editable PowerPoint slide and a Word version.
Written and tested by Allen, AFFiNE content team. Updated November 14, 2026. Every workbook was recalculated in LibreOffice 26.8 and checked against an independent schedule calculation before publication, so the dates, statuses, and late flags in the examples and preview images are the files' actual outputs. The multi-project workbook was also opened in Apple Numbers 14.4 on a Mac. Platform claims were checked against Microsoft Support, Google Docs Editors Help, and Apple Support, following AFFiNE's editorial policy. All example projects are fictional.
Quick Answer: Which Gantt Chart Template Should You Use?
| Template | Time scale | Best for | Download |
|---|---|---|---|
| Weekly (with dependencies) | Weeks | Most projects of 1–4 months | XLSX |
| Simple | Weeks | Typing your own dates, no formulas to learn | XLSX |
| Daily | Days | Sprints, events, and plans under 4 weeks | XLSX |
| Monthly (12 months) | Months | Roadmaps and annual plans | XLSX |
| Multi-project | Weeks | Several projects on one sheet | XLSX |
| Construction | Weeks | Fit-outs, renovations, permits, inspections | XLSX |
| Marketing campaign | Weeks | Launches and campaigns | XLSX |
| Agile and software | Weeks | Releases planned in sprints | XLSX |
| Event planning | Weeks | Conferences and company events | XLSX |
| PowerPoint slide | Weeks | Sponsor and client updates | PPTX |
| Word document | Weeks | Proposals and printed plans | DOCX |
All files are free, with no sign-up. Every workbook has a Start Here tab, a filled Example sheet, a Blank sheet ready for your project, and a Holidays tab. Yellow cells are inputs and blue cells are formulas.
What a Good Gantt Chart Template Includes
| Part | What it does | In these templates |
|---|---|---|
| Task list | One row per task, one owner each | ID, Task, Owner |
| Date math | End date from start + duration | WORKDAY formulas |
| Dependencies | Later tasks move when earlier ones slip | Predecessor ID column |
| Milestones | Zero-length checkpoints | Duration 0 → diamond |
| Progress | Share of each task done | % complete → dark bar |
| Status date | "Where are we now?" line | Late flag + ▼ marker |
If a template makes you type start and end dates by hand for every task, it's a drawing, not a schedule. The first slipped task will leave every later date wrong. The one exception is the simple template below, which is built for people who want to type dates and still get workday counts and late flags.
Free Gantt Chart Templates for Excel and Google Sheets
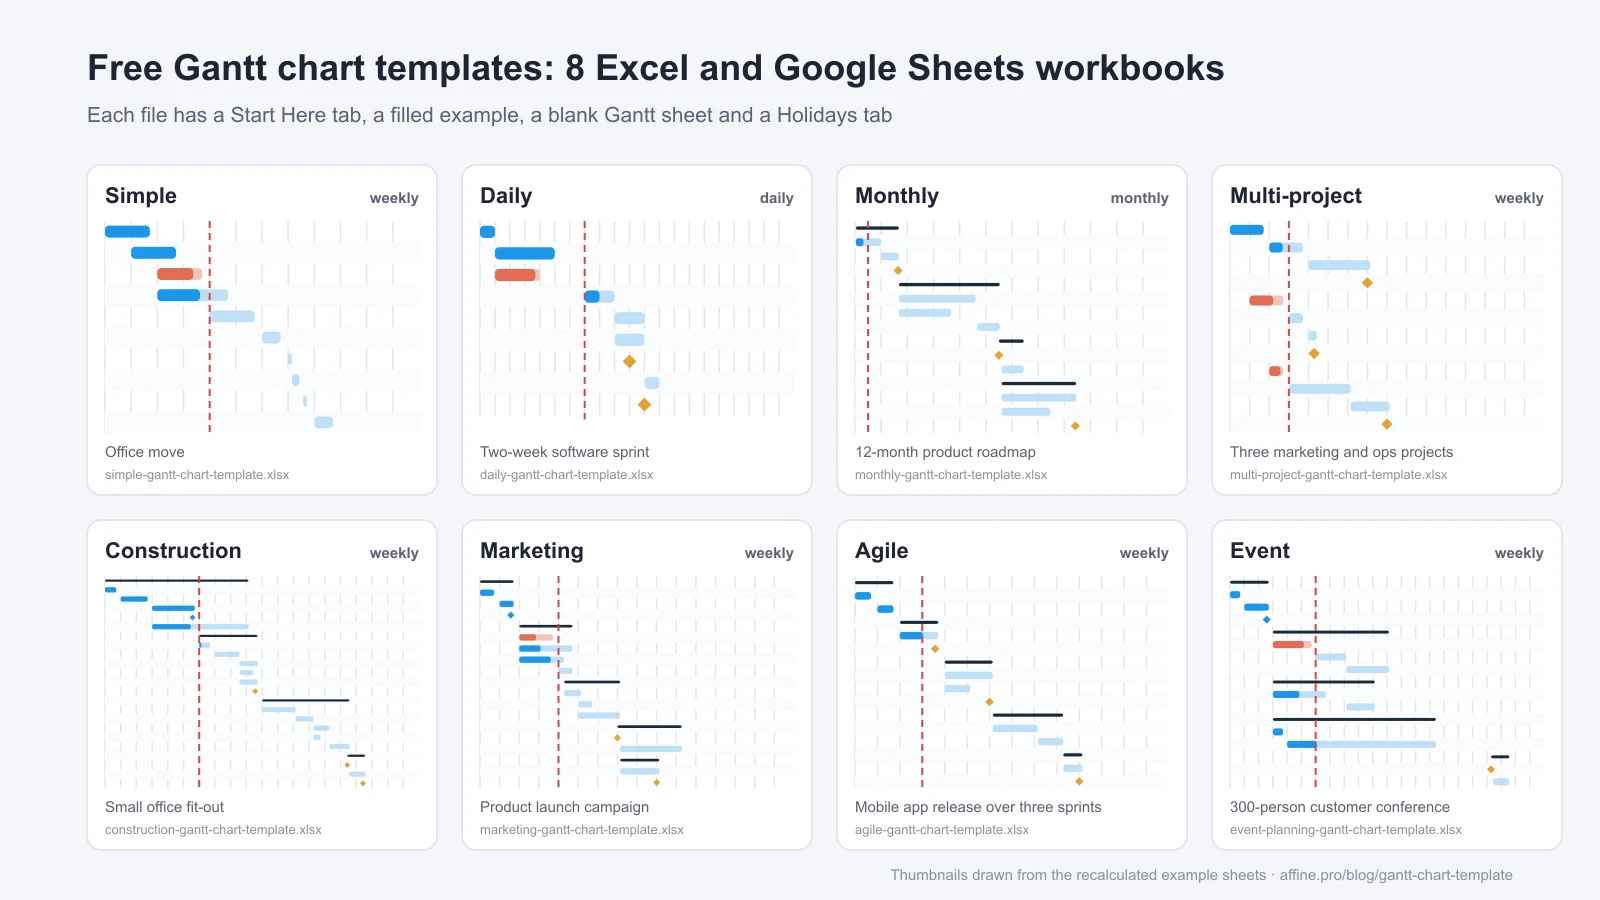
Each workbook below opens in Excel and Google Sheets. The preview images are drawn from each file's recalculated Example sheet, with a status date of Nov 16, 2026.
Weekly Gantt Chart Template with Dependencies
The original template on this page and the best starting point for most projects. Durations are in workdays, each task can wait for one predecessor, and the timeline runs for 16 weeks from the project start.
- Example inside: a fictional 10-week website relaunch with 12 tasks and 3 milestones, explained step by step in the filled example below.
- Sheets: Start Here, Gantt Example, Gantt Blank, Holidays.
- Download the weekly Gantt chart template (XLSX)
Simple Gantt Chart Template
For people who want to type start and end dates and see bars straight away. There are no predecessor formulas to learn: the sheet counts the workdays in each task, shades the weeks it covers, and flags anything unfinished past its end date.
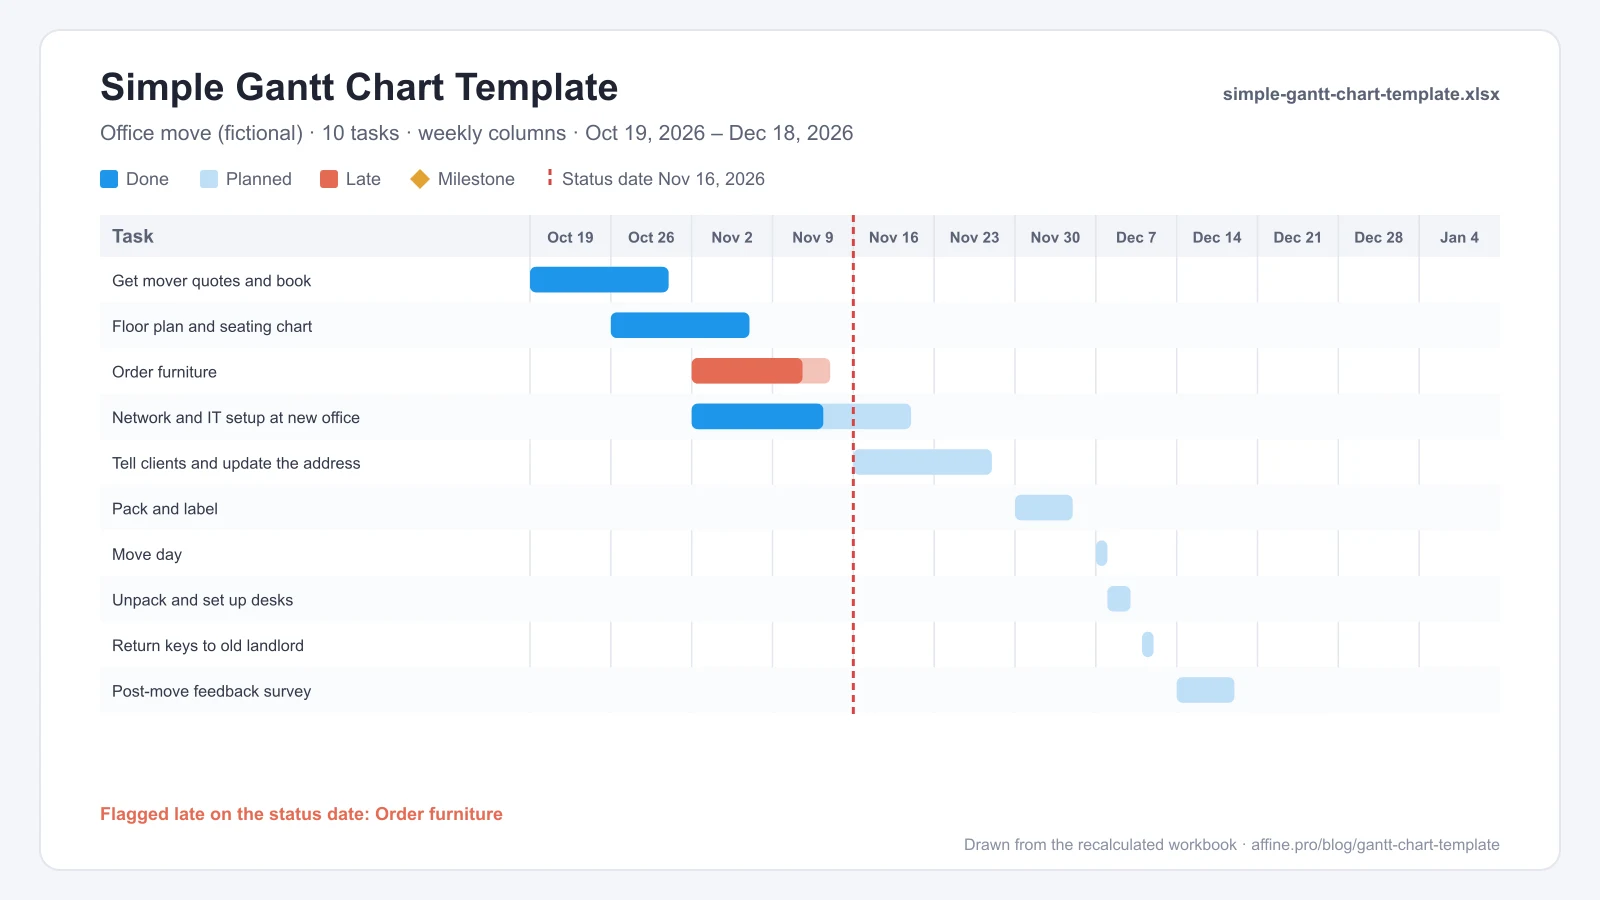
- Example inside: an office move with 10 tasks from Oct 19 to Dec 18, 2026. "Order furniture" ended on Nov 13 at 80% complete, so it shows as Late.
- Trade-off: dates don't move on their own. If one task slips, retype the dates that follow it, or switch to the weekly template.
- Download the simple Gantt chart template (XLSX)
Daily Gantt Chart Template
One column per day for plans measured in days rather than weeks: a software sprint, an event week, a move, or a short client engagement. The timeline shows 21 days, and weekends stay visible so you can see where the work pauses.
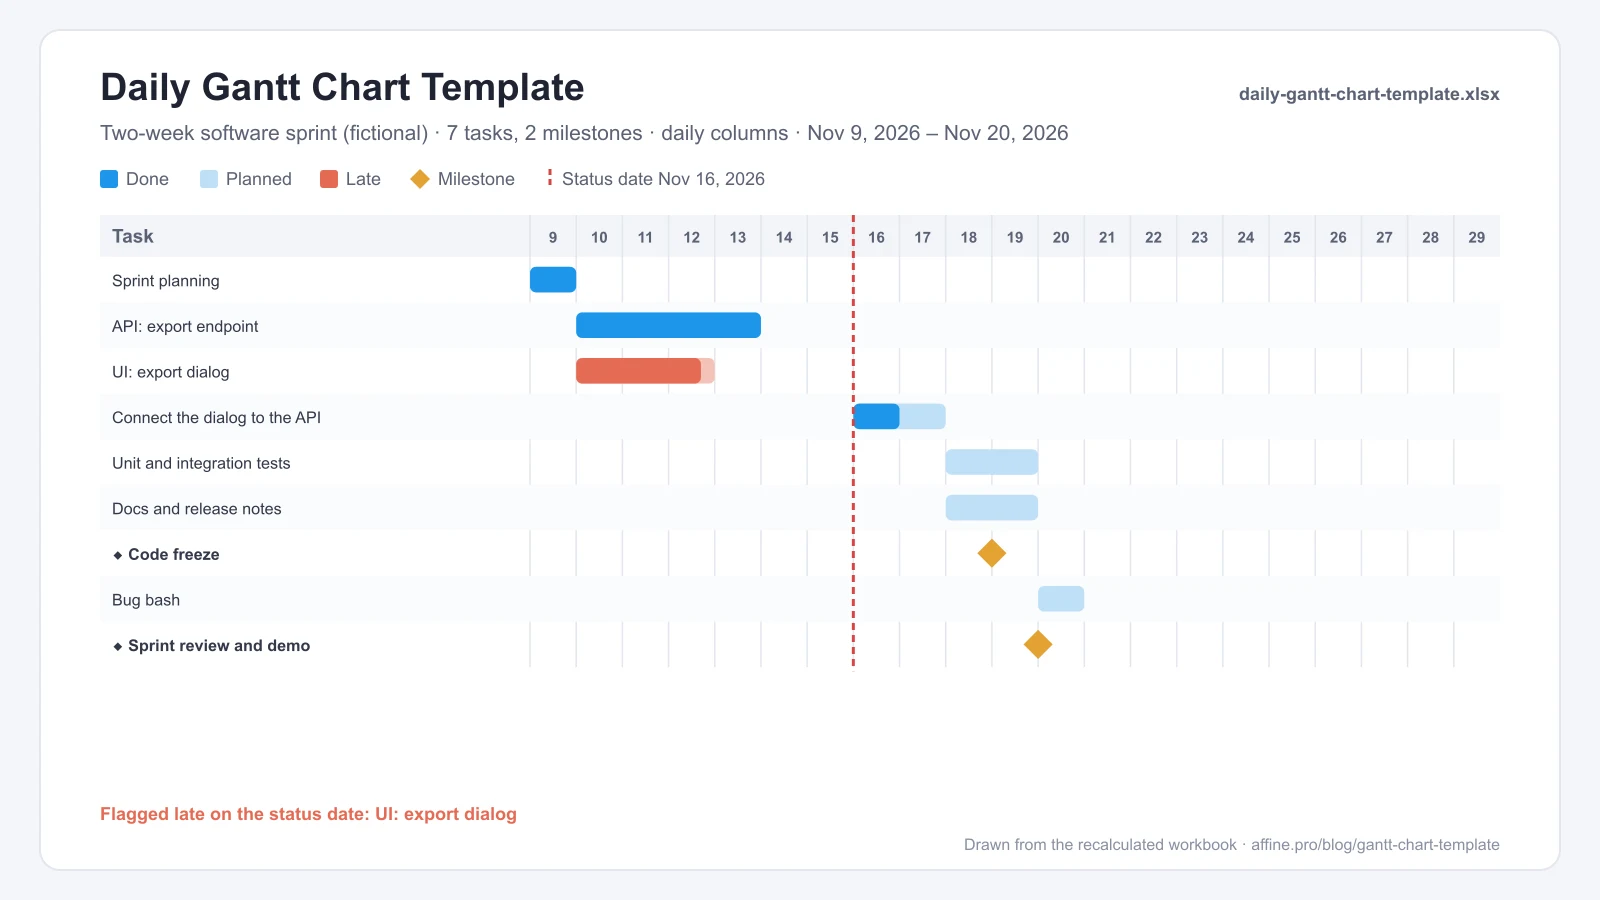
- Example inside: a two-week sprint with 7 tasks and 2 milestones from Nov 9 to Nov 20, 2026. The "UI: export dialog" task should have finished on Nov 12 and is flagged Late at 90%.
- Tip: for longer daily plans, copy the last timeline column to the right. Each new column adds one day.
- Download the daily Gantt chart template (XLSX)
Monthly and 12-Month Gantt Chart Template
One column per month across a full year, for product roadmaps, annual plans, and multi-quarter programs. Grey phase rows roll up the tasks below them: earliest start, latest end, and a duration-weighted % complete.
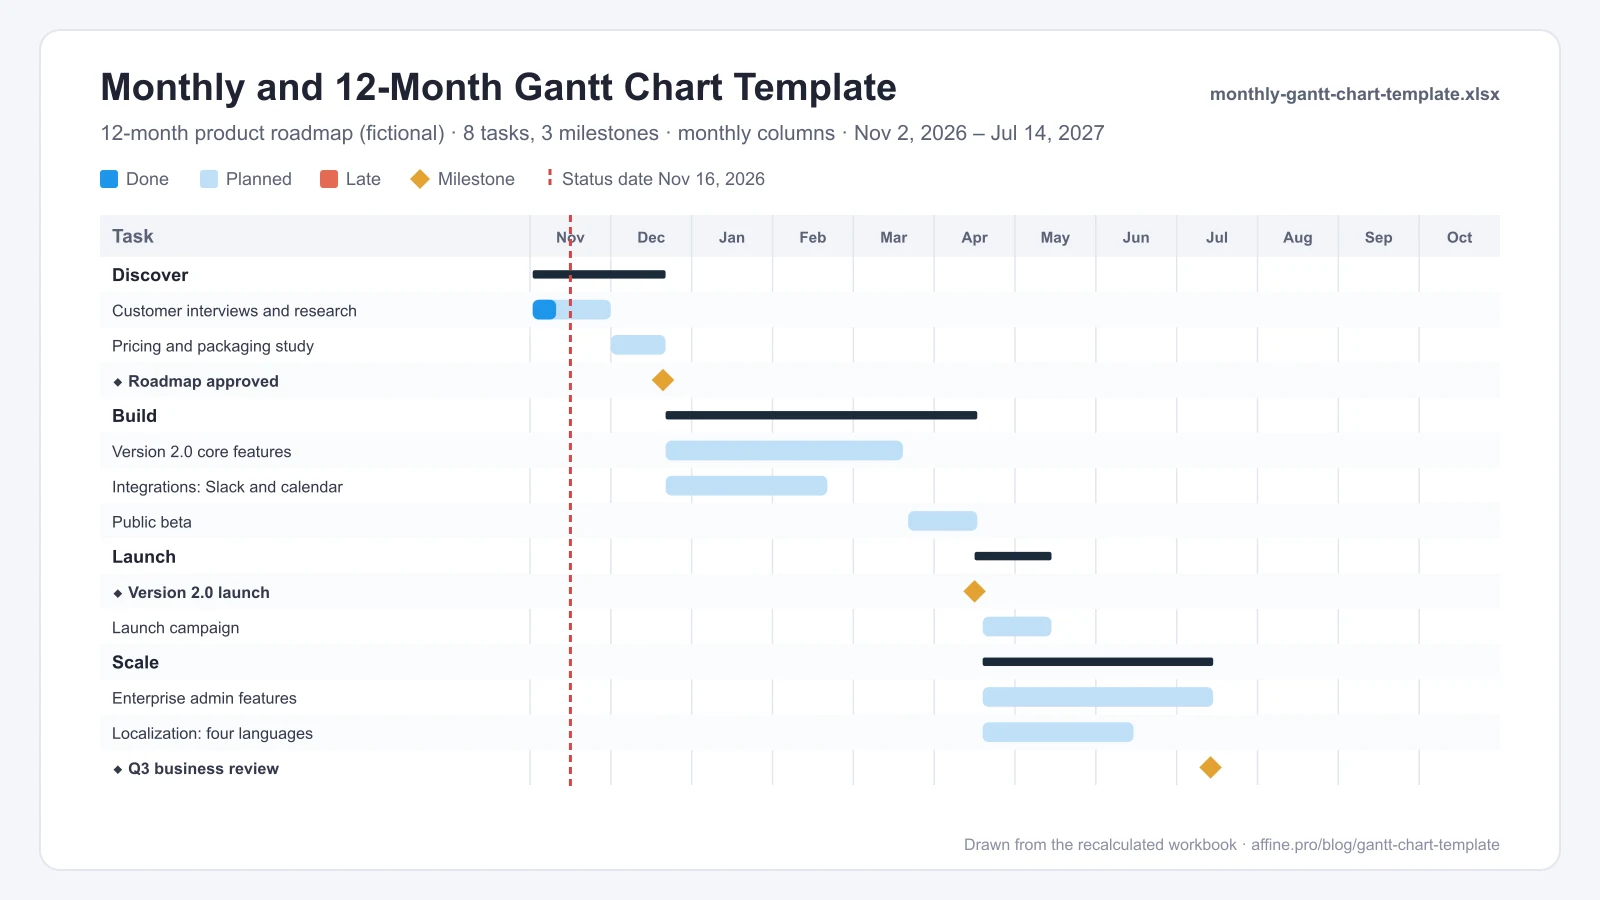
- Example inside: a product roadmap with four phases (Discover, Build, Launch, Scale), 8 tasks, and 3 milestones from Nov 2, 2026 to Jul 14, 2027.
- When to use it: when the reader cares about quarters, not days. For a high-level plan you'll present rather than track, see our guide to project roadmaps.
- Download the monthly Gantt chart template (XLSX)
Multi-Project Gantt Chart Template
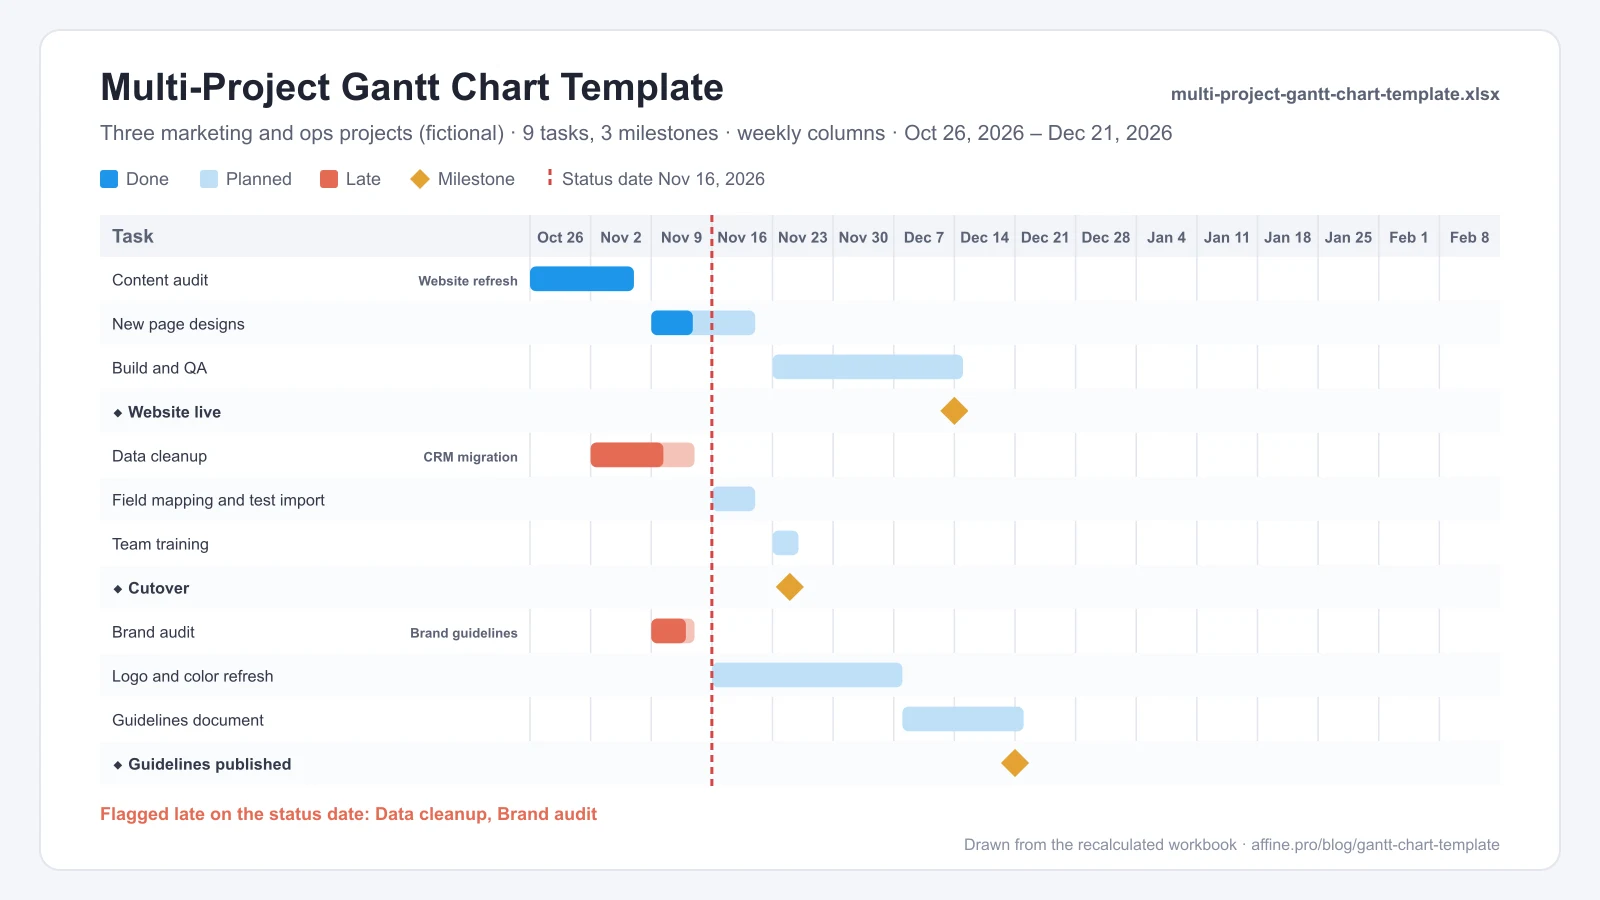
Adds a Project column to the Gantt sheet and a Projects tab that summarizes each project's start, finish, number of tasks, late tasks, and % complete. Use it when one person or team runs several small projects at once.
| Project (example) | Start | Finish | Late tasks | % complete |
|---|---|---|---|---|
| Website refresh | Oct 26, 2026 | Dec 14, 2026 | 0 | 40% |
| CRM migration | Nov 2, 2026 | Nov 25, 2026 | 1 | 39% |
| Brand guidelines | Nov 9, 2026 | Dec 21, 2026 | 1 | 13% |
- Example inside: three projects with 9 tasks and 3 milestones. The table above is the Projects tab as calculated on the Nov 16 status date.
- Compatibility: the Projects tab uses MINIFS and MAXIFS, which need Excel 2019 or later, Microsoft 365, Google Sheets, Numbers, or LibreOffice. The Gantt sheet itself works in older Excel versions.
- Download the multi-project Gantt chart template (XLSX)
Construction Gantt Chart Template
Built around the phases most building projects share: preconstruction, demolition and rough-in, finishes, and closeout. Permits, inspections, and handover are milestones, so the dates that depend on an inspector are easy to see.
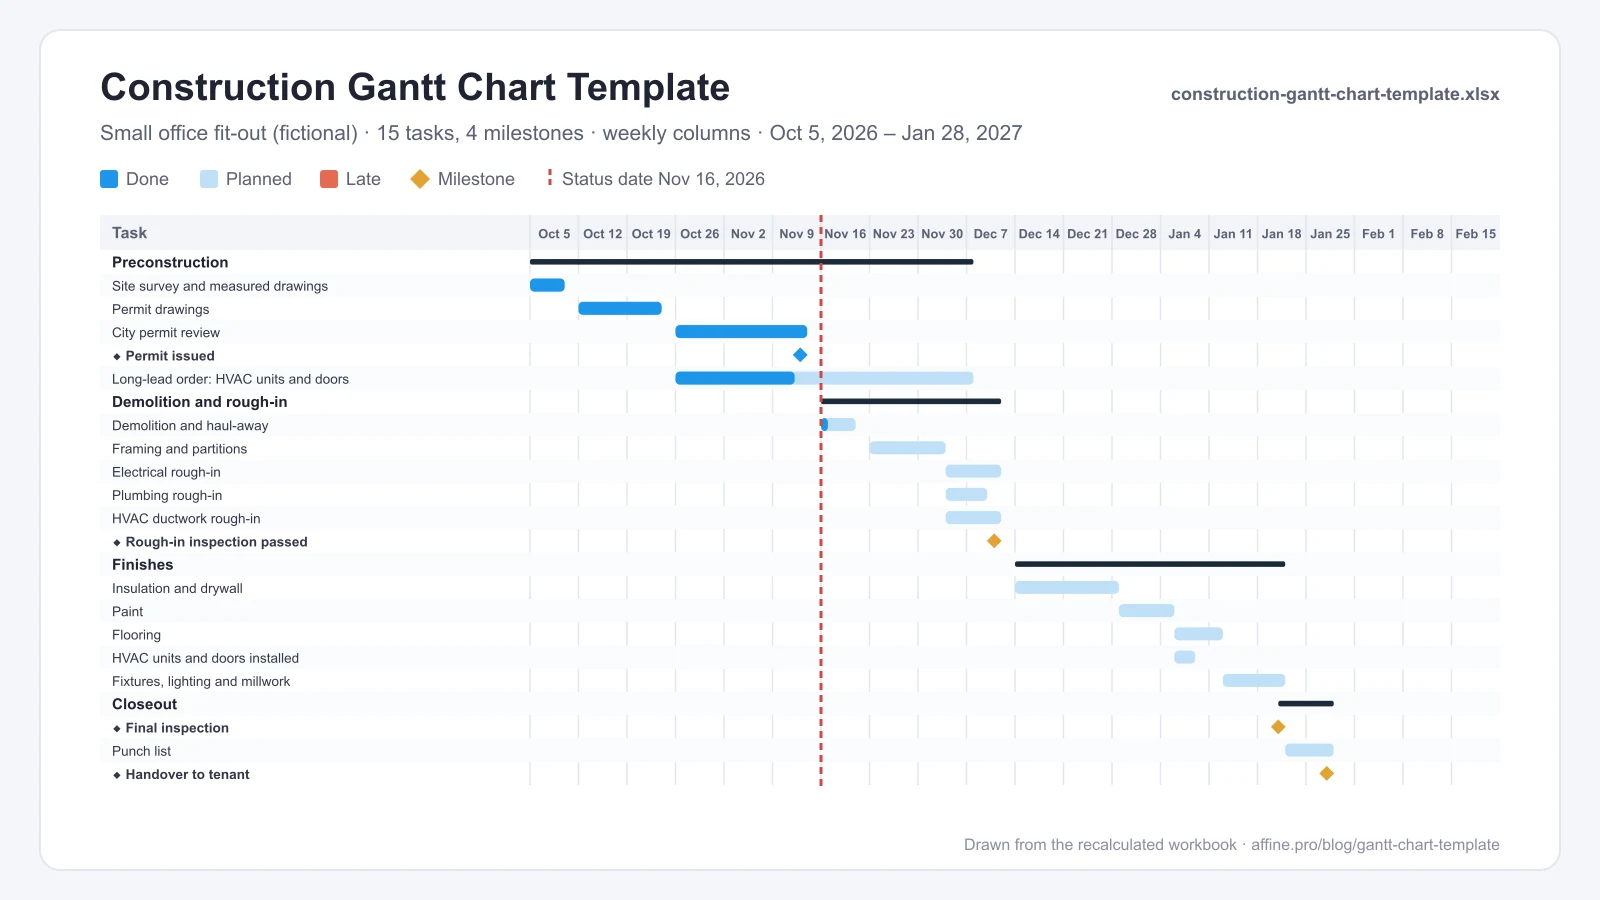
- Example inside: a small office fit-out with 15 tasks and 4 milestones from Oct 5, 2026 to Jan 28, 2027. The permit was issued on Nov 13, the rough-in inspection is due Dec 11, and handover is Jan 28.
- Why workdays matter here: drywall that starts on Dec 14 finishes on Dec 28 because the template skips Christmas. Add your crew's non-working days to the Holidays tab.
- Download the construction Gantt chart template (XLSX)
Marketing Campaign Gantt Chart Template
Plans a launch from strategy to measurement: strategy, content, channels, launch, and measure phases, with the launch day as a milestone everything else points at.
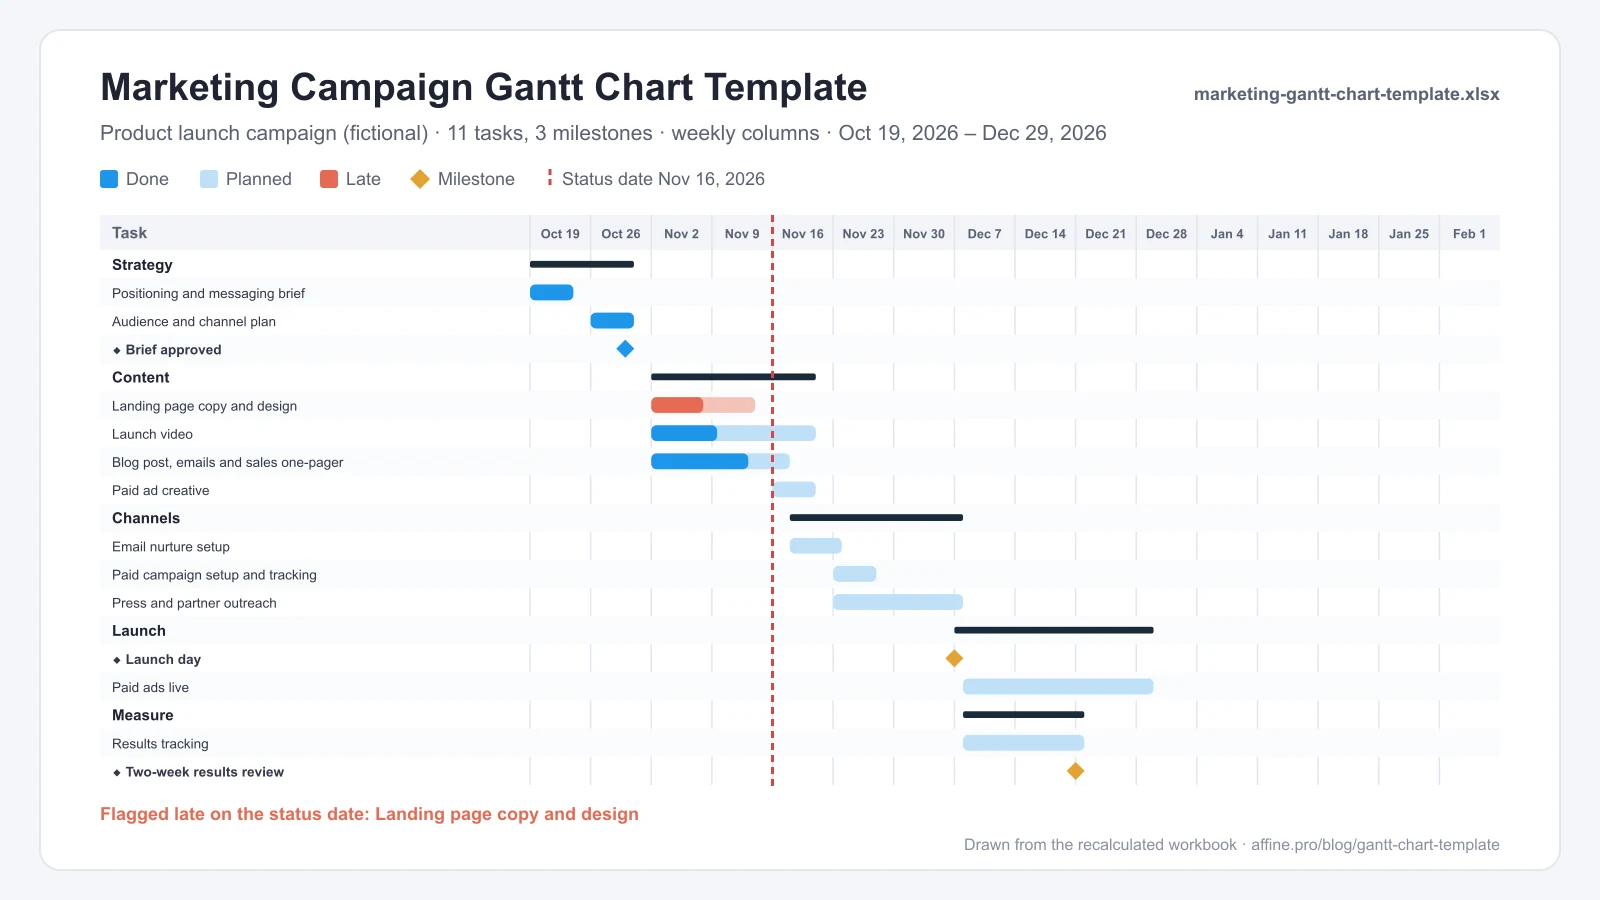
- Example inside: a product launch campaign with 11 tasks and 3 milestones from Oct 19 to Dec 29, 2026. The landing page should have finished on Nov 13 and is flagged Late at 50%, three weeks before the Dec 7 launch.
- Download the marketing Gantt chart template (XLSX)
Agile and Software Gantt Chart Template
Agile teams plan work sprint by sprint, but stakeholders still ask when the release ships. This template groups the work by sprint, with a review milestone at the end of each one, so you can answer that question without pretending every story is scheduled.
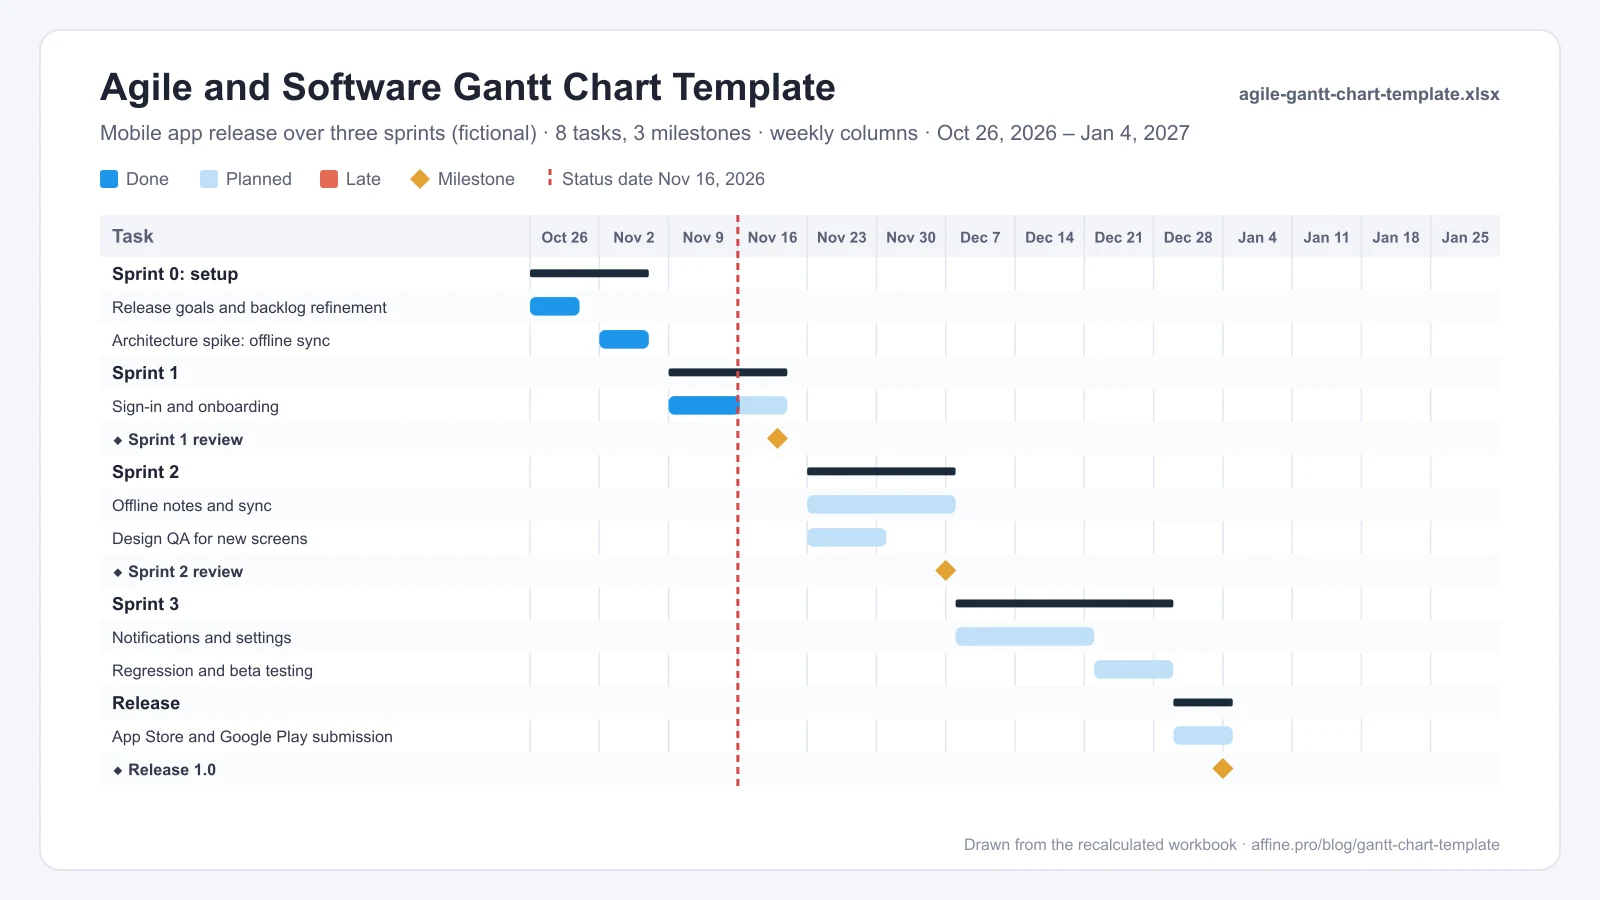
- Example inside: a mobile app release with Sprint 0 to Sprint 3, 8 tasks, and 3 milestones from Oct 26, 2026 to the Release 1.0 milestone on Jan 4, 2027.
- Keep the board for daily work: track individual stories on a Kanban board and use the Gantt chart for sprint dates and the release.
- Download the agile Gantt chart template (XLSX)
Event Planning Gantt Chart Template
Events have one date that can't move, so this template works back from it: plan, program, vendors, promotion, and the event itself, with the venue contract and conference day as milestones.
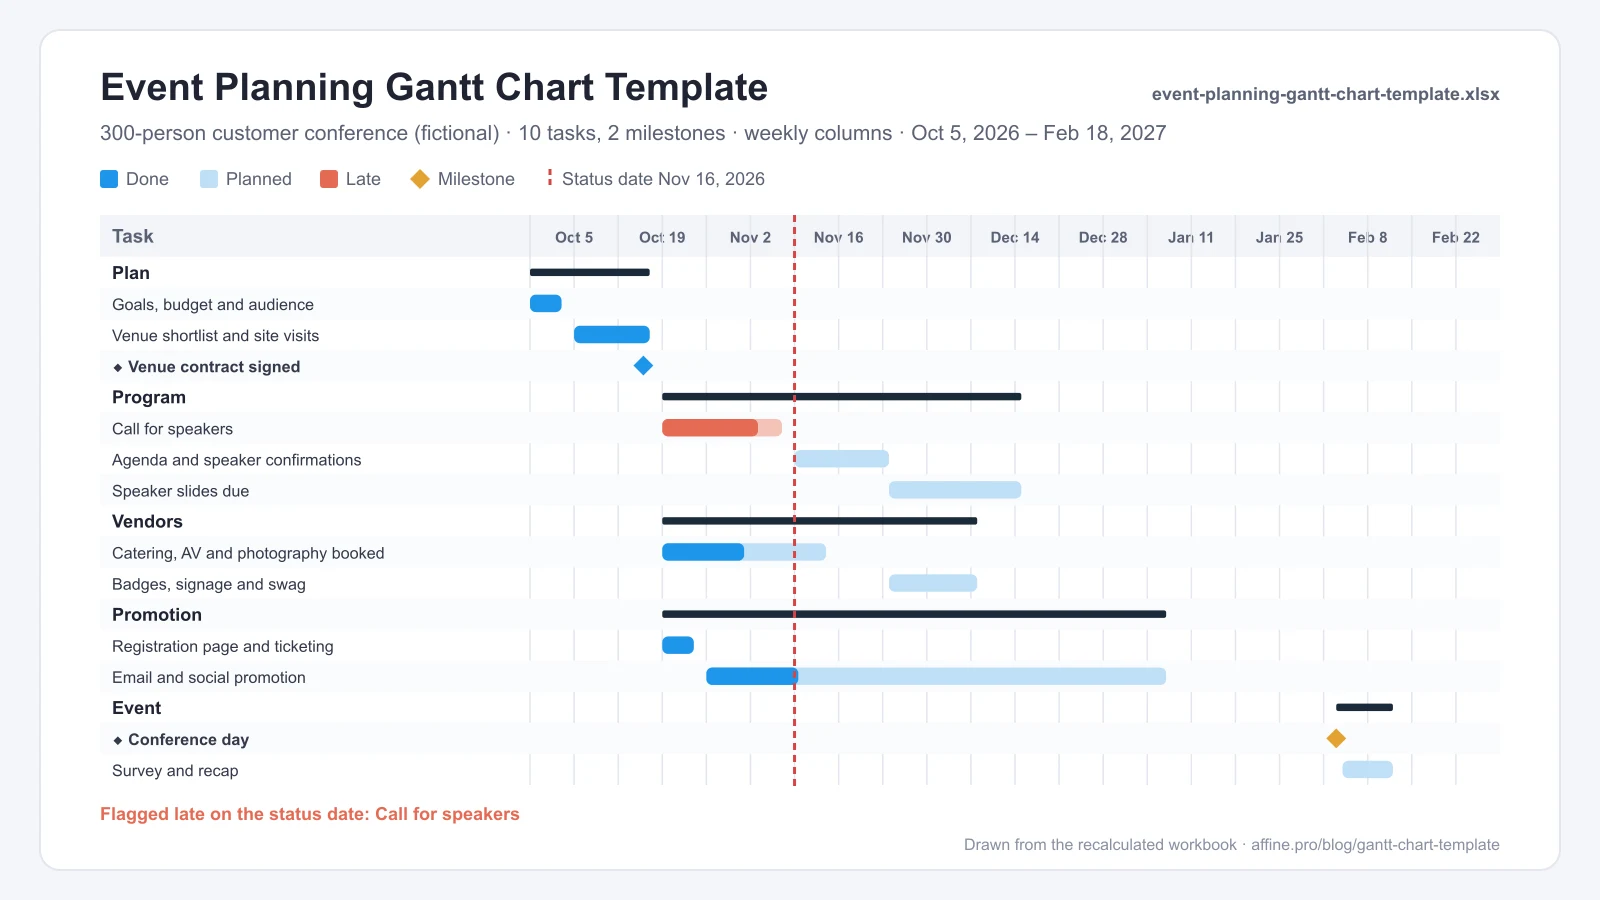
- Example inside: a 300-person customer conference with 10 tasks and 2 milestones from Oct 5, 2026 to Feb 18, 2027. The call for speakers ended on Nov 13 at 80% and is flagged Late.
- Tip: the conference day has a fixed date in the Pinned start column. If the tasks before it ever push past that date, the milestone moves later, which is your early warning to cut scope or add help.
- Download the event planning Gantt chart template (XLSX)
PowerPoint, Word, and CSV Gantt Chart Templates
PowerPoint and Word can't calculate dates. Keep the live schedule in a spreadsheet and use these files to present or print it.
PowerPoint Gantt Chart Template
Slide 1 draws the website-relaunch example with native, editable shapes: blue for done, light blue for planned, coral for late, and amber diamonds for milestones, plus a status-date line. Slide 2 is a blank 10-task layout. Aim for 10–15 rows per slide, grouped by phase or milestone rather than every task, and update the slide after each weekly review so the deck never shows a different date than the workbook.
Word Gantt Chart Template
A landscape Word document for proposals, statements of work, and printed plans. Page 1 is the website-relaunch example as a shaded table, copied from the recalculated workbook. Page 2 is a blank 15-task, 10-week grid: write the week dates in the header and shade the cells each task covers.
CSV Task Lists
- Download the example task list (CSV): the 12 website-relaunch tasks with start, end, duration, predecessor, and status. Use it to test an import into Google Sheets, Microsoft Project, or another planning tool.
- Download the blank task list (CSV): column headers only.
What Is a Gantt Chart Template?
A Gantt chart is a bar chart of a schedule: time runs left to right, and each task is a bar whose length is its duration. It is named after Henry L. Gantt, who popularized the format in the 1910s. A template is a pre-built file where the structure, formulas, and formatting are already done, so you only enter tasks, durations, and dependencies.
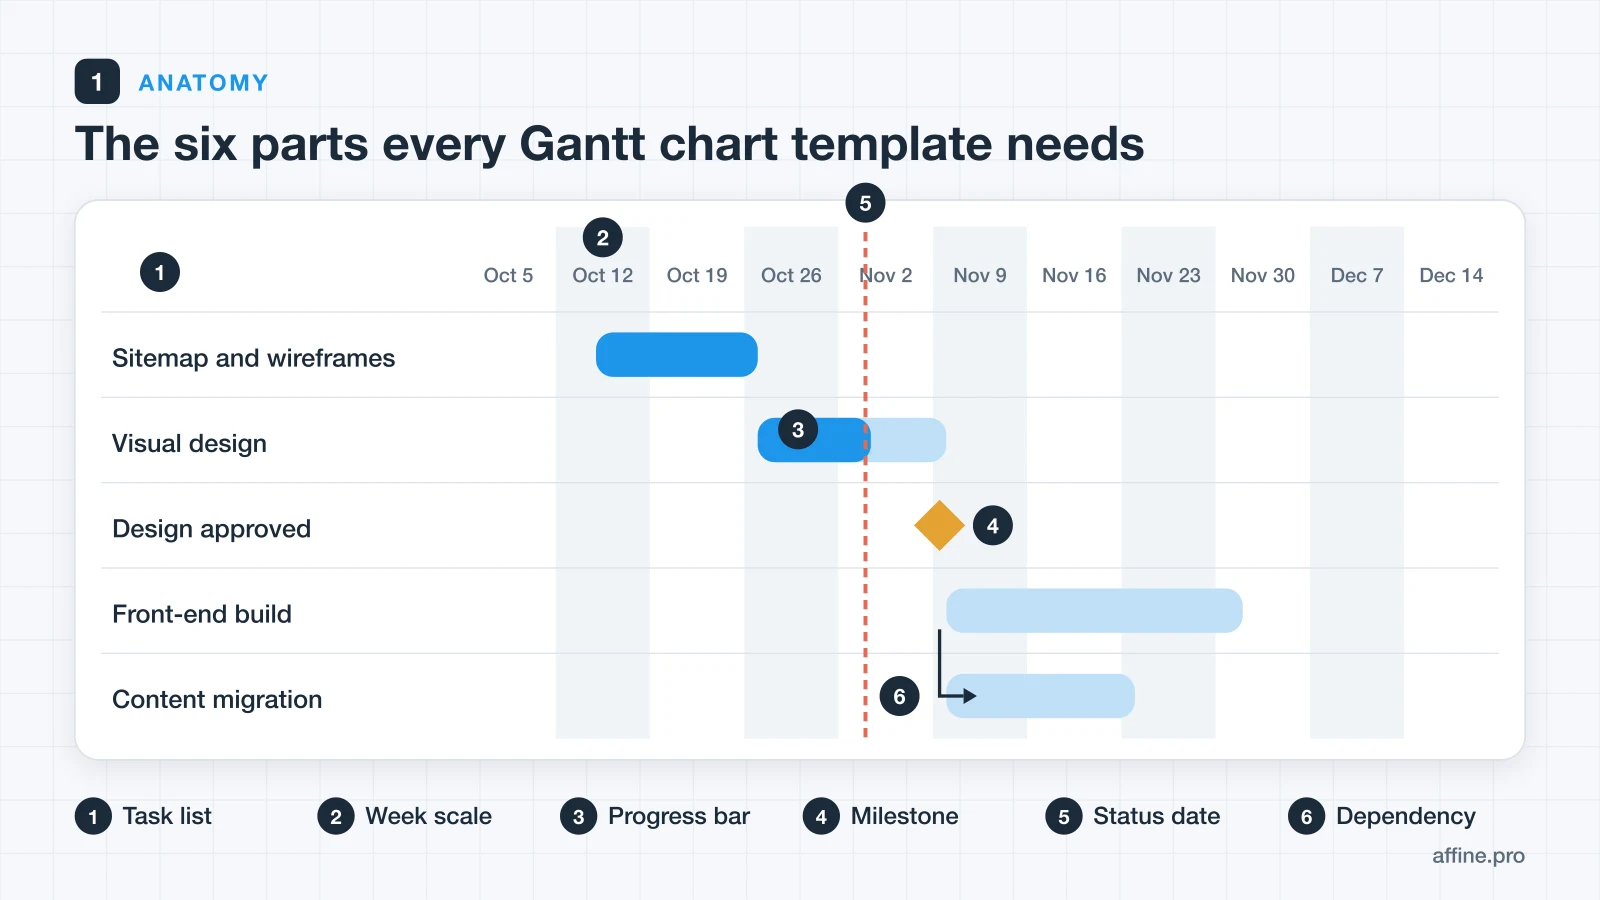
Every useful Gantt chart template has the same six parts:
- Task list. One row per deliverable or activity, each with a single owner.
- Time scale. Days, weeks, or months across the top. Weeks suit most projects of 1–4 months, days suit sprints and events, and months suit roadmaps.
- Bars. Drawn from start to end dates, ideally by formula rather than by hand.
- Milestones. Zero-duration checkpoints such as approvals and launches, usually shown as diamonds.
- Dependencies. "B can't start until A finishes" (finish-to-start), so changes flow through the plan.
- A status date. The line that turns a plan into a progress report: anything unfinished to its left is late.
How the Free Gantt Chart Templates Work
The workbooks calculate dates the way a project scheduler does, using only standard spreadsheet functions.
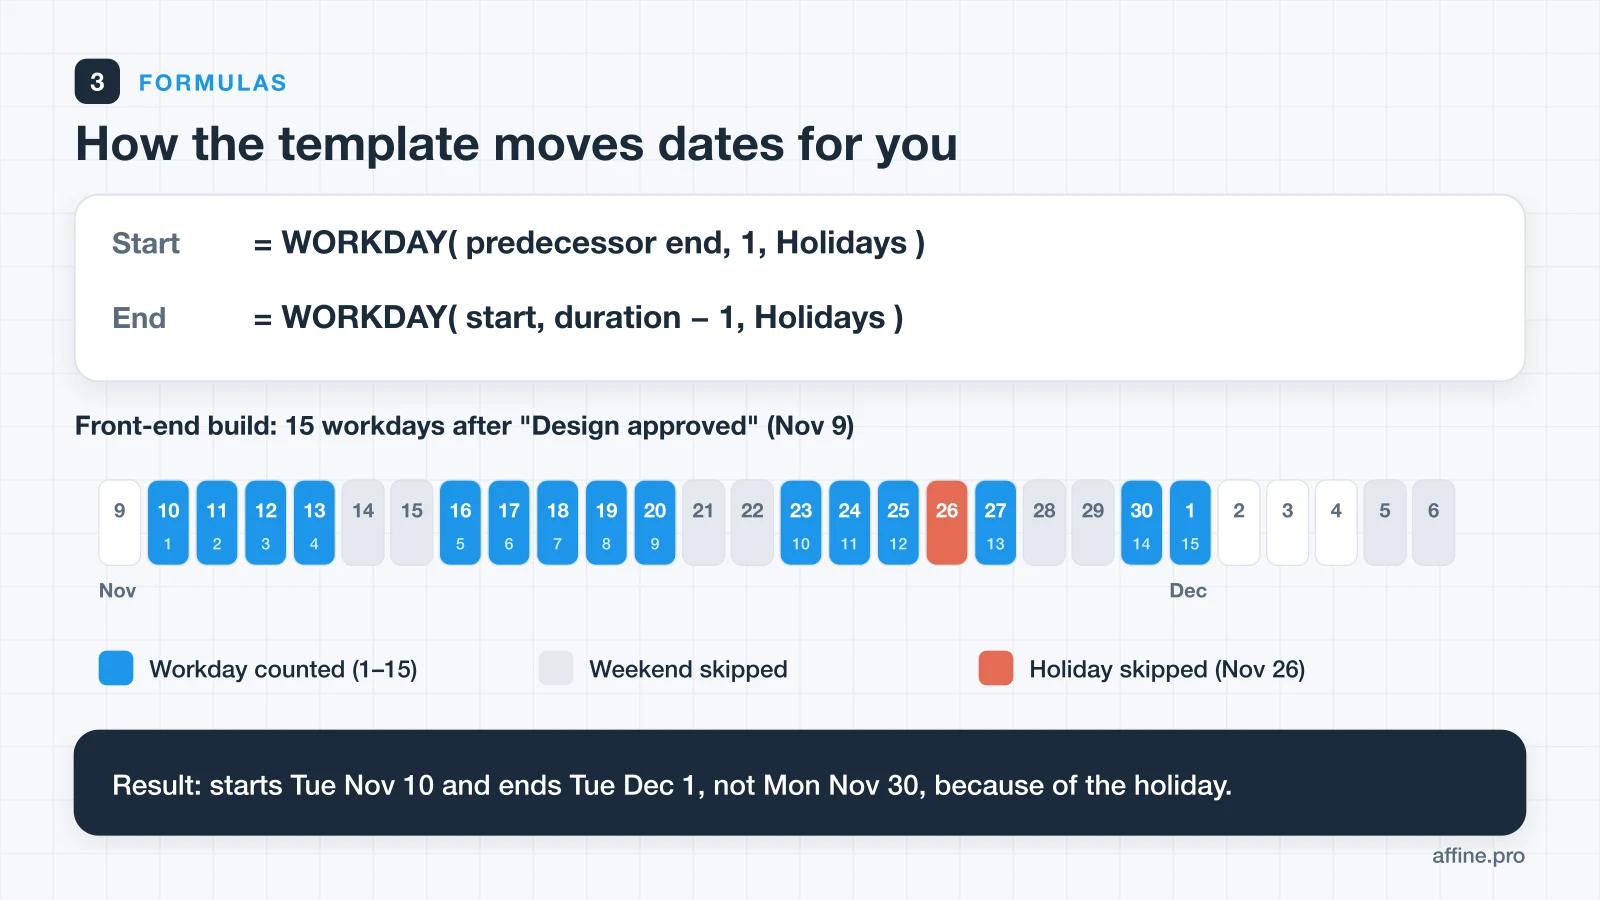
- Start date = the workday after the predecessor ends:
WORKDAY(predecessor end, 1, Holidays). If you enter a pinned start that falls later, the pinned date wins. Use it for the first task, or to hold a task until a fixed date. - End date =
WORKDAY(start, duration − 1, Holidays). Durations are in workdays, so weekends and every date on the Holidays tab are skipped. According to Microsoft's WORKDAY documentation, the function excludes weekends and any dates you list as holidays, and Google Sheets' WORKDAY function takes the same arguments. - Milestones have a duration of 0 and sit on their predecessor's end date.
- Bars are drawn in timeline columns. A dark block (▓) means the column is covered by completed work, a light block (▒) means planned work, and a diamond (◆) marks a milestone. In Excel and Google Sheets, conditional formatting turns these into solid colored bars. Late tasks turn coral.
- Phase rows (monthly, construction, marketing, agile, and event templates) take the earliest start and latest end of the tasks below them and draw a grey summary bar.
- Status is calculated per row: Done at 100%, Late if the end date is before the status date and the task isn't finished, and otherwise In progress, Not started, or Milestone.
In the weekly example, "Front-end build" starts on Tue Nov 10, the workday after the design approval milestone on Nov 9. Fifteen workdays would end on Mon Nov 30, but the template skips Thanksgiving (Nov 26), so the end date is Tue Dec 1.
Limits, stated plainly: one predecessor per row (for several, enter the one that finishes last), finish-to-start links only, and the predecessor must be listed above the task. There is no resource leveling or critical-path calculation. Those limits keep the files fast and readable in any spreadsheet app. When you need more, see Gantt chart makers and dedicated project software.
Filled Example: A Website Relaunch Gantt Chart
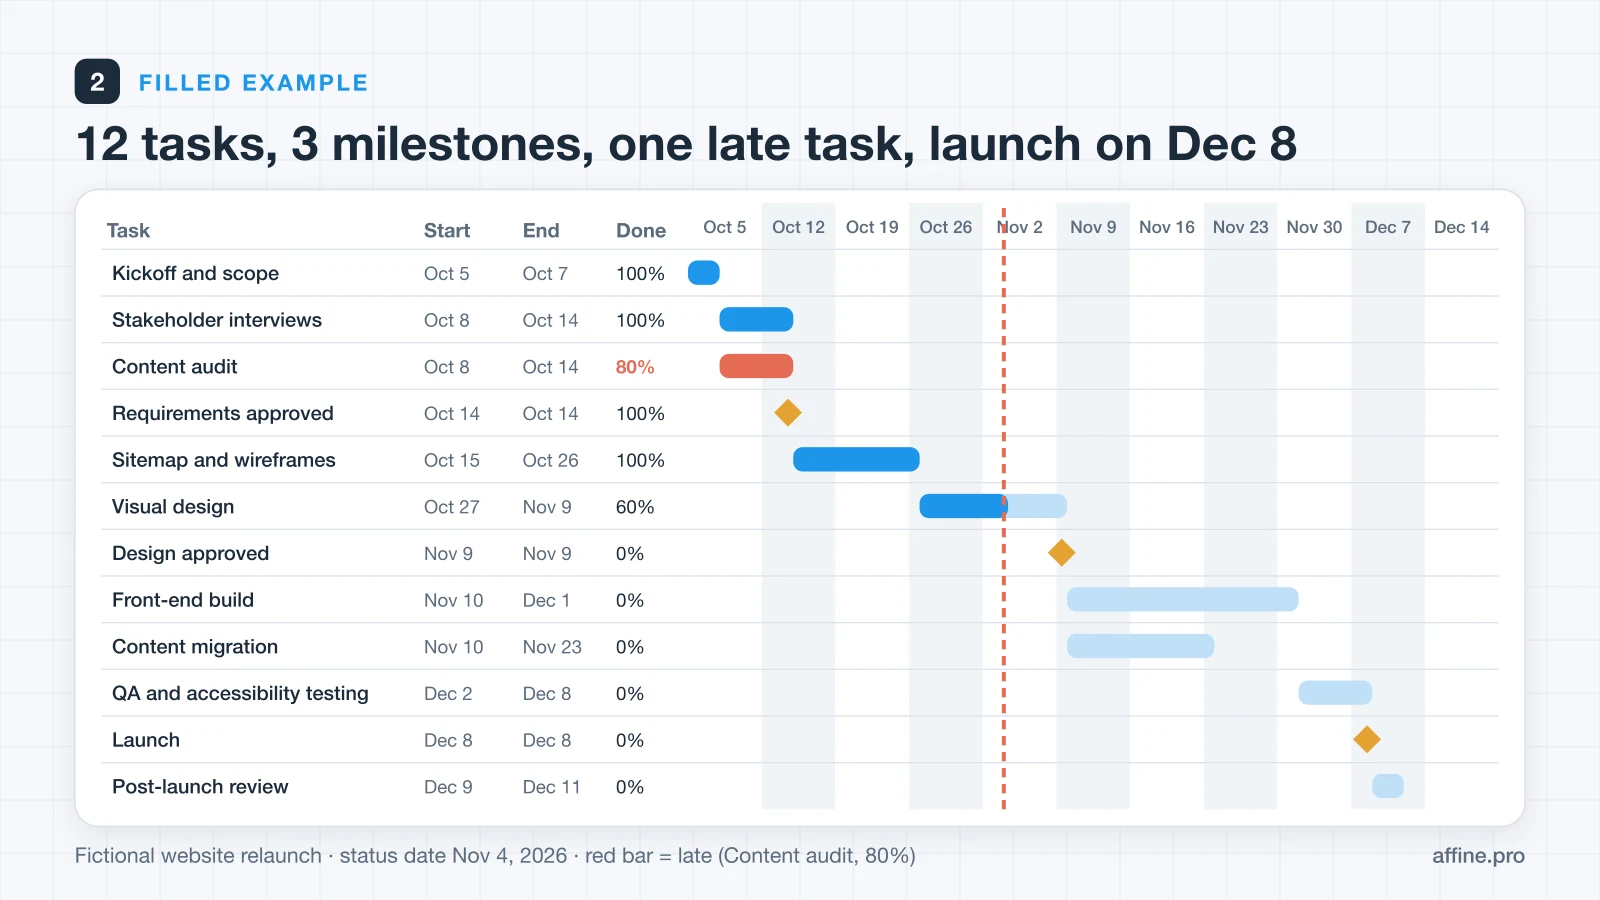
The Gantt Example tab of the weekly template plans a fictional 10-week website relaunch. Its status date is Nov 4, 2026.
| Task | Start | End | Depends on | Status (Nov 4) |
|---|---|---|---|---|
| Kickoff and scope | Oct 5 | Oct 7 | Pinned | Done |
| Stakeholder interviews | Oct 8 | Oct 14 | 1 | Done |
| Content audit | Oct 8 | Oct 14 | 1 | Late (80%) |
| ◆ Requirements approved | Oct 14 | Oct 14 | 2 | Done |
| Sitemap and wireframes | Oct 15 | Oct 26 | 4 | Done |
| Visual design | Oct 27 | Nov 9 | 5 | In progress (60%) |
| ◆ Design approved | Nov 9 | Nov 9 | 6 | Milestone |
| Front-end build | Nov 10 | Dec 1 | 7 | Not started |
| Content migration | Nov 10 | Nov 23 | 7 | Not started |
| QA and accessibility testing | Dec 2 | Dec 8 | 8 | Not started |
| ◆ Launch | Dec 8 | Dec 8 | 10 | Milestone |
| Post-launch review | Dec 9 | Dec 11 | 11 | Not started |
The chart tells you three things at a glance. The content audit should have finished on Oct 14 and is flagged red. Visual design is 60% done with three workdays left. The build and content migration can run in parallel because both depend only on the design approval. If visual design slips by two days, both tasks, QA, the launch, and the review all move automatically.
How to Set Up Your Gantt Chart Template in 6 Steps
- Set the status date. Enter the date you are reporting on at the top of the sheet. The blank sheet uses TODAY(); fix the date when you need a reproducible snapshot.
- Add your holidays. List company holidays and planned closures on the Holidays tab so every start and end date skips them. The files ship with US holidays from Thanksgiving 2026 to Labor Day 2027 as examples; replace them with your own.
- List tasks in order. Enter one task per row with an ID and a single owner. Put each task below the task it depends on.
- Enter durations in workdays. Type the number of working days for each task, and enter 0 for milestones such as approvals and launch dates.
- Link dependencies. Enter the predecessor's ID for each task that must wait, and add a pinned start only for the first task or a fixed date.
- Update % complete every week. Ask each owner to update their own rows, then review every task marked Late before you share the chart.
If you haven't broken the work into tasks yet, our guide on how to create a project timeline walks through scoping, sequencing, and estimating before you open the template.
How to Customize Your Gantt Chart Template
- Change the time scale. Pick the daily or monthly template rather than squeezing a different scale into the weekly one. To extend any timeline, copy the last timeline column to the right.
- Add columns, not colors. Budget, risk, or phase columns belong to the left of Status. Keep bar colors for meaning (done, planned, late, milestone) so readers never need a legend to decode decoration.
- Group by phase. In the templates with phase rows, insert task rows inside a phase so its summary range stretches. In the weekly template, add a bold phase row and leave its duration blank so it draws no bar.
- Freeze a baseline. Before the kickoff, copy the Start and End columns and paste them as values into "Baseline start" and "Baseline end" columns. Comparing the live dates against them shows how far the plan has moved.
- Keep it under about 60 rows. A Gantt chart past a couple of screens stops being readable. Split it into phase sheets, use the multi-project template, or move to dedicated software.
Gantt Chart Templates by App
Excel
Excel has no built-in Gantt chart type. Microsoft's own guidance simulates one with a stacked bar chart, hiding the "start" series so only the duration bars show. That works for a static picture, but the chart doesn't know about dependencies or holidays.
These templates take the grid approach instead: dates come from WORKDAY formulas, and bars are cells colored by conditional formatting. Change a duration, and every dependent date and bar updates. Excel is the best fit when one person owns the schedule, the plan needs detail, or the file has to work offline or print cleanly. Only the multi-project Projects tab needs Excel 2019 or later, because it uses MINIFS and MAXIFS.
Google Sheets
To use a template in Google Sheets, upload the XLSX to Drive and open it, or create a new spreadsheet and use File → Import. Google's guide to using Excel files in Sheets covers both workflows. The formulas are standard functions, and the bar colors come from conditional formatting, which Sheets supports with custom formulas.
Sheets also has a native timeline view (Insert → Timeline) that draws cards from a start-date and end-date column. According to Google Docs Editors Help, it is available on Google Workspace editions such as Business Standard, Business Plus, Enterprise, and Education, and each task's start date must be earlier than its end date. The Start and End columns in these templates are date formatted, so on a Workspace account you can point a timeline view at them for a card-style second view. Personal Google accounts can use the templates but not timeline view.
Choose Sheets when several people update the plan, when you want comments on individual tasks, or when stakeholders need a live link rather than an emailed file.
Mac and Apple Numbers
On a Mac, the templates work in Excel for Mac, Google Sheets in a browser, and LibreOffice. Apple Numbers can also open Excel files. When we opened the multi-project workbook in Numbers 14.4, every Start, End, Status, and Projects-tab value matched the Excel version, but the colored bar formatting did not carry over: the timeline showed the ▓ ▒ ◆ characters instead of solid bars. The schedule is still readable, and you can add a fill color to those cells by hand. For solid bars without Excel, use Google Sheets.
PowerPoint and Word
PowerPoint and Word are presentation layers, not schedulers. Keep the schedule in the spreadsheet, then update the PowerPoint slide or the Word table from it on a fixed schedule.
How to Choose the Best Gantt Chart Template
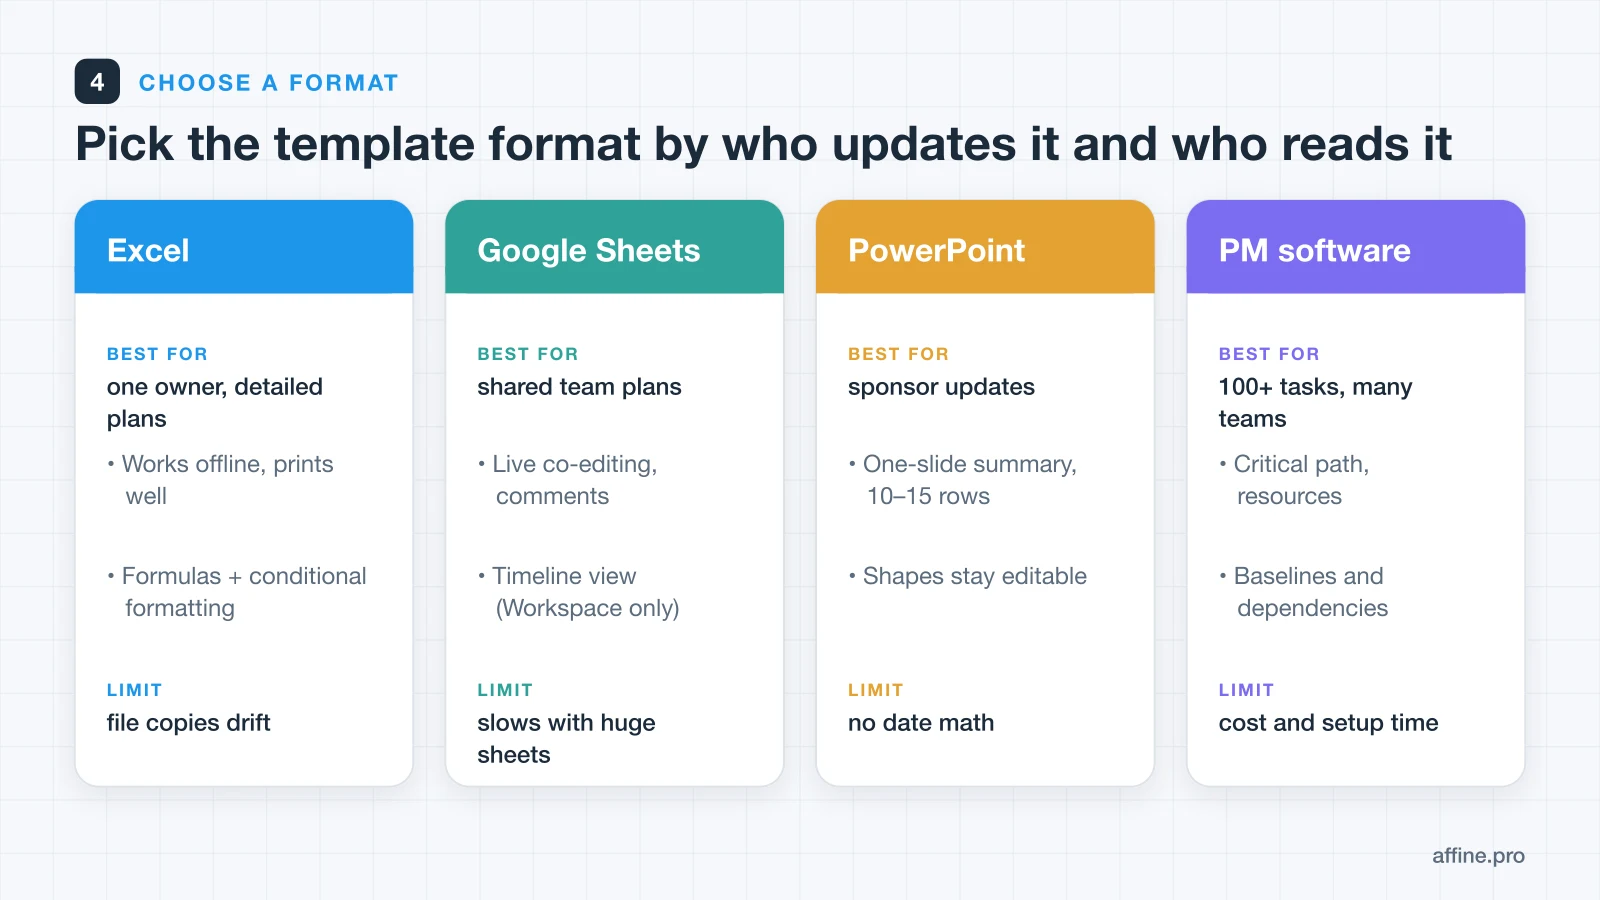
| If you… | Use | Why |
|---|---|---|
| Own the plan alone | Excel template | Detail, offline, prints well |
| Share updates with a team | Google Sheets | Live editing, comments |
| Report to sponsors | PowerPoint slide | One readable summary |
| Need it in a proposal | Word template | Static table that prints |
| Run 100+ tasks or many teams | PM software | Critical path, resources |
Many teams use two formats: the spreadsheet as the source of truth and a slide as the weekly summary. If you're still choosing what kind of plan you need, compare these with our project planning templates, timeline templates, and project planner template. For other ways to draw a schedule, see Gantt chart alternatives and PERT charts.
How to Keep a Gantt Chart Up to Date
Most Gantt charts go stale quickly after kickoff. A 15-minute weekly routine keeps yours useful:
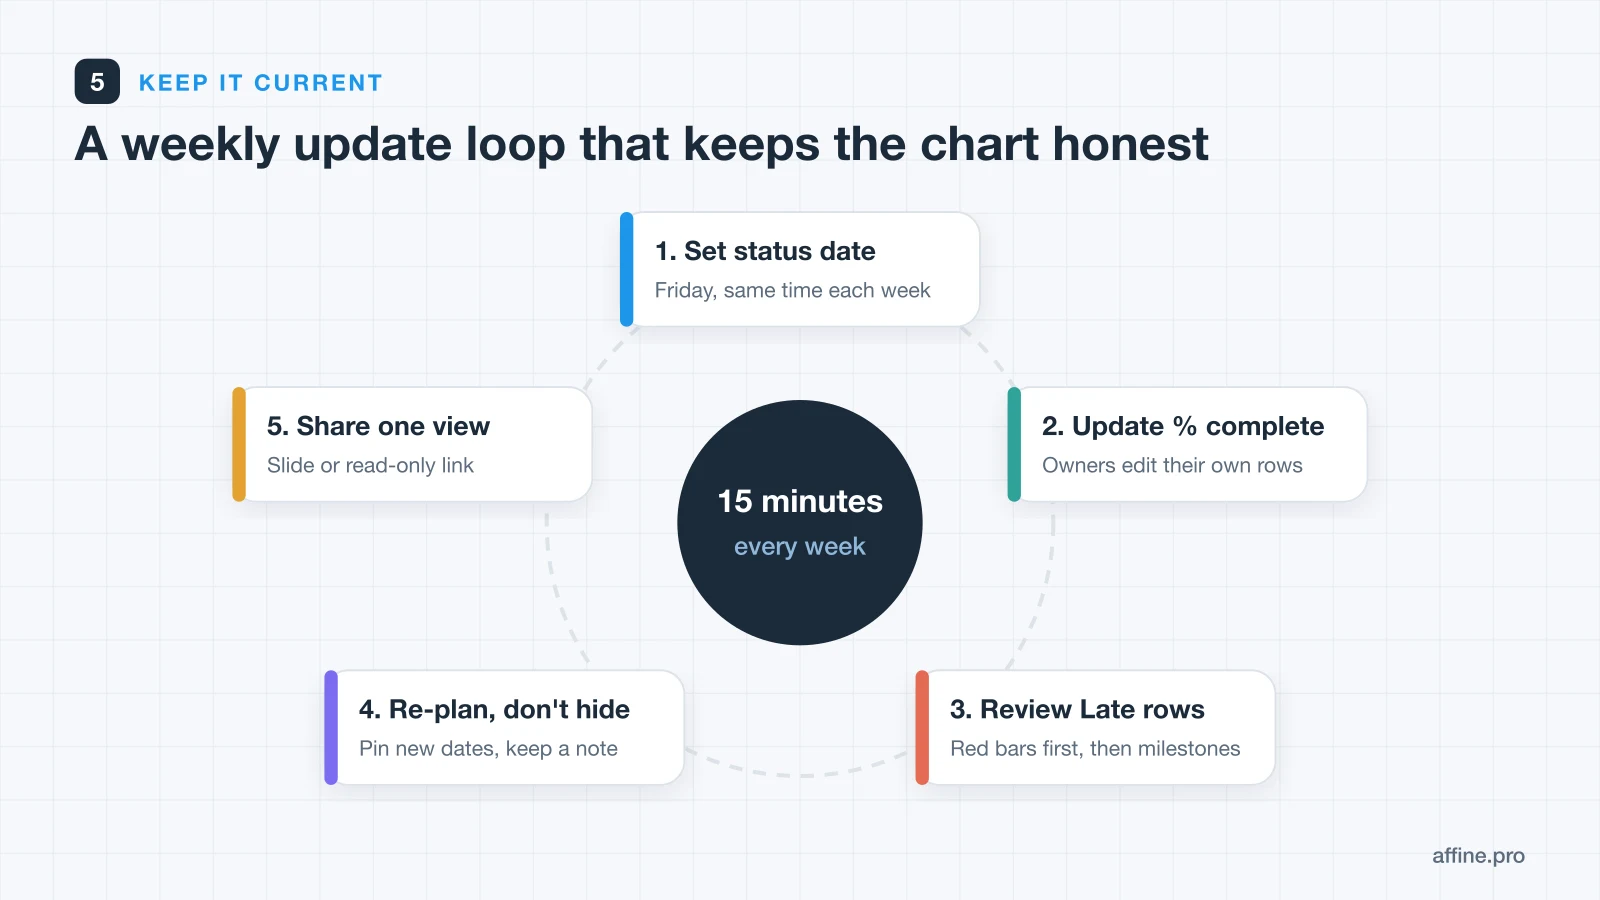
- Set the status date at the same time each week, such as Friday afternoon.
- Have owners update % complete on their own rows.
- Review red rows first, then the next milestone.
- Re-plan in the open. Change durations or add a pinned start, and note why in a comment. Don't quietly stretch bars.
- Share one view. Send the slide or a read-only link, not several versions of the file.
When to Move From a Template to Project Software
A spreadsheet Gantt chart stops being the right tool when one of these becomes true:
- Tasks wait on more than one predecessor, or you need start-to-start and finish-to-finish links.
- You need the critical path calculated, not eyeballed.
- People are shared across projects and you need to see who is overbooked.
- More than one person edits dates every day, and version conflicts start costing time.
- The plan passes about 100 tasks, or several teams need their own views of it.
At that point, compare project planning tools for teams or online Gantt chart makers. Export the CSV first, so your task list moves with you.
When NOT to Use a Gantt Chart
- Continuous flow work. Support queues, content pipelines, and bug triage have no fixed end date, so a Kanban board fits better.
- Highly uncertain research. When you can't estimate durations, a list of milestones and time-boxed experiments is more honest than bars.
- Very small projects. Five tasks and one owner need a checklist, not a chart.
- Huge programs. Hundreds of interdependent tasks need critical-path analysis, resource leveling, and baselines, which spreadsheets don't do well.
File Compatibility and License
| File | Opens in | Calculates dates | Notes |
|---|---|---|---|
| 9 XLSX workbooks | Excel, Google Sheets, LibreOffice, Numbers | Yes | Numbers shows bars as characters |
| PPTX slide | PowerPoint | No | Editable shapes |
| DOCX document | Word | No | Landscape, two pages |
| CSV task lists | Any spreadsheet or PM tool | No | Plain text import |
License: the files are free to use, copy, and edit for your own projects, personal or work. Please don't resell the templates or republish them as a download.
Where AFFiNE Fits
AFFiNE isn't a Gantt chart tool. Its database documentation lists Table and Kanban views as available today, with a Timeline view on the roadmap. Where it helps is the project context around the schedule: the brief, decisions, meeting notes, and a task table, all in one workspace, with a link to the Gantt workbook. You can also start from AFFiNE's project timeline template, or sketch a high-level roadmap on the whiteboard before you commit dates to the spreadsheet.
Frequently Asked Questions About Gantt Chart Templates
Are these Gantt chart templates really free?
Yes. All nine XLSX workbooks, the PPTX slide, the DOCX document, and both CSV files on this page can be downloaded without payment or sign-up. You can edit and reuse them for your own personal or work projects; please don't resell the files.
Do the Gantt chart templates work in Google Sheets?
Yes. Upload the XLSX to Google Drive and open it, or import it with File → Import. The date formulas and conditional-formatting bars carry over, and Workspace accounts can add a native timeline view from the Start and End columns.
Do the Gantt chart templates work on a Mac?
Yes. They work in Excel for Mac, Google Sheets, and LibreOffice. Apple Numbers opens them and calculates the dates and statuses, but it doesn't keep the colored bar formatting, so the timeline shows block characters instead of solid bars.
Is there a Gantt chart template in Word?
Yes. The Word template has a filled example table on page 1 and a blank 15-task, 10-week grid on page 2. Word has no scheduling formulas, so keep the live dates in a spreadsheet and update the Word table from it.
Is there a monthly or 12-month Gantt chart template?
Yes. The monthly template has one column per month for 12 months, with phase rows that roll up their tasks. Its example is a product roadmap from November 2026 to July 2027.
Can I track several projects in one Gantt chart?
Yes. The multi-project template adds a Project column and a Projects tab that shows each project's start, finish, number of tasks, late tasks, and % complete. Keep the total under about 60 rows so the chart stays readable.
Who invented the Gantt chart?
The Gantt chart is named after Henry L. Gantt, an American engineer who popularized the format in the 1910s for scheduling production work. Today the same bar-chart idea is used in spreadsheets and project management software.
What's the difference between a Gantt chart and a Kanban board?
A Gantt chart shows when work happens and how tasks depend on each other over time. A Kanban board shows what stage each work item is in (such as to do, doing, done) without dates. Use a Gantt chart for projects with deadlines and dependencies, and Kanban for continuous flow work.
What's the difference between a Gantt chart and a project timeline?
A project timeline usually shows key dates and milestones along a single line. A Gantt chart shows every task as a bar with a start, an end, an owner, and dependencies, so you can see overlap and knock-on effects.
How many tasks should a Gantt chart template have?
For a readable spreadsheet Gantt chart, stay under about 60 rows; for a slide, 10–15 rows. Beyond that, split the plan by phase or use dedicated project management software.
Sources and Verification
This guide and the downloadable files were checked on November 14, 2026.
- Microsoft Support: Present your data in a Gantt chart in Excel: Excel's stacked-bar Gantt method.
- Microsoft Support: WORKDAY function: workday arithmetic that excludes weekends and listed holidays.
- Microsoft Support: MINIFS function: available in Excel 2019 and later and Microsoft 365.
- Google Docs Editors Help: WORKDAY: the same function in Google Sheets.
- Google Docs Editors Help: Create & edit a timeline view: Workspace editions and the start-before-end date requirement.
- Google Docs Editors Help: Use both Excel & Sheets: opening and importing XLSX files in Sheets.
- Google Docs Editors Help: Use conditional formatting rules in Google Sheets: custom-formula formatting.
- Apple Support: Import an Excel or text file into Numbers on Mac: opening XLSX files in Numbers.
- AFFiNE Docs: Blocks with Databases: available and planned database views.
Every workbook's Start, End, Status, phase roll-up, and timeline outputs were recalculated in LibreOffice and compared with a separate schedule calculation; the preview images, the Projects table above, the Word example, and the CSV were generated from those verified values. All example projects are fictional teaching examples.