How to Create a Flowchart in Google Docs: Editable Example
To make an editable flowchart in Google Docs, use the desktop website and choose Insert → Drawing → New. Build the chart from shapes and connecting lines, add your labels, then save it into the document. Keep the drawing as your editable source; a pasted screenshot cannot be edited one node at a time.
This guide walks through one small application-review process: Submit application → Check information → approve or return for corrections. You can copy the labels below and rebuild it without an add-on.
Scope and method: checked against Google’s documentation on October 9, 2026. The visuals are original schematics, not Google Docs screenshots. We did not retest this workflow in a signed-in Google account; core menu paths are documented, while save/reopen and connector checks below should be verified in your own document. This tutorial assumes an online desktop browser.
Choose how your flowchart will stay editable
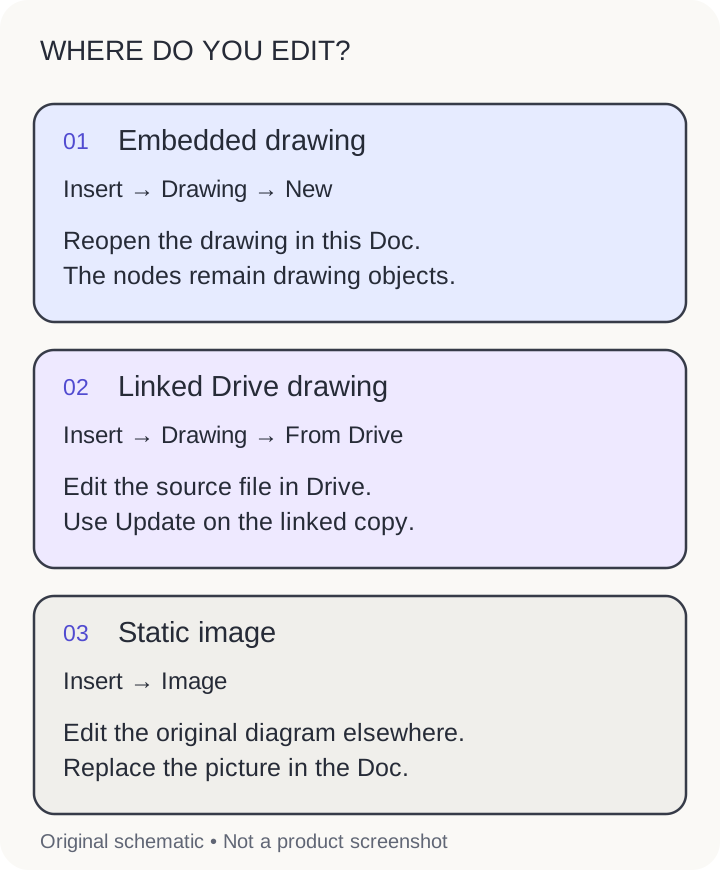
There are three different objects you can put in a document. Choose before you start:
| Method | Where you revise the chart | Best fit |
|---|---|---|
| Insert → Drawing → New | Reopen the embedded drawing in that document | A small chart belonging to one document |
| Insert → Drawing → From Drive | Edit the original Google Drawings file; refresh its linked copy in Docs | One diagram reused in several documents |
| Insert → Image | Edit the original diagram elsewhere, then replace the image | A finished illustration whose individual shapes do not need editing in Docs |
Google’s drawing help documents both drawing paths, the shape/text/line tools, and the Update and Unlink controls for a drawing inserted from Drive. Editing a linked source does not mean every document has already refreshed its displayed copy.
What is a Flowchart?
A flowchart represents the steps and decisions in a process with shapes and directional lines. A useful chart answers two questions: what happens next, and which condition changes the path?
Common Flowchart Symbols:
For this example, you only need three shapes:
- Rounded rectangle: the start or a completed outcome.
- Rectangle: an action, such as checking an application.
- Diamond: a question that branches into labeled answers.
Use arrows to show direction. A repeat is a line returning to an earlier step, not a special oval “looping” symbol. Keep colors optional: the words Yes and No must explain the branch even in a black-and-white printout.
Benefits of Using Flowcharts
A chart makes a handoff visible. Here, the reviewer either approves the application or returns it; the applicant corrects it before the reviewer checks again. Writing both paths prevents “Return” from becoming a dead end with no next action.
Flowchart Examples
A complete application-review example
This simplified example assumes that complete information is sufficient for approval. If your real process also checks eligibility or budget, add another decision before approval.
| Shape | Copy this text | Place it |
|---|---|---|
| Rounded rectangle | Submit application | Top center |
| Rectangle | Check information | Below the start |
| Diamond | Information complete? | Below the check |
| Rounded rectangle | Approve application | Below the diamond, on the Yes path |
| Rectangle | Return for corrections | To the right of the diamond, on the No path |
| Rectangle | Correct and resubmit | Below Return for corrections; connect back to Check information |
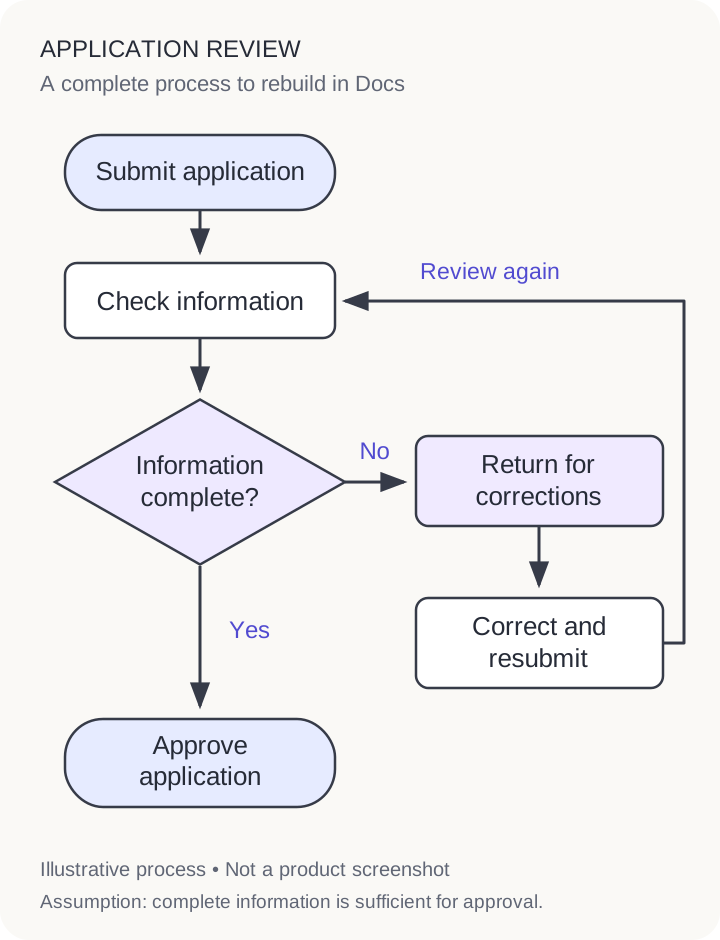
Open the full-size flowchart reference or download the node-and-connection checklist. The SVG is a visual reference, not a Google Drawings template. Rebuild the shapes in Docs for node-level editing; inserting an exported image does not convert it into native shapes.
Step-by-Step Guide: Creating Flowcharts in Google Docs
Step 1. Choose A Google Document
Open Google Docs in a desktop browser and create a blank document or open your existing one. Make sure you have permission to edit. Put the cursor where the chart should appear, ideally below the paragraph that introduces the process.
Keep the six labels in the table nearby. Decide how wide the finished chart can be on the page before adding long text. For this layout, leave space on the right for corrections and a narrow return route along the outer edge.
Step 2. Open Drawing Tool
Choose Insert → Drawing → New. Google’s desktop documentation confirms this path; the drawing editor is where you assemble the objects before inserting them into the document.
Locate Shape, the line-selection menu, and Text box. Shapes and connecting lines serve different jobs: a block arrow from the shape menu is a shape itself, while the line menu offers lines, arrows, and connector types. Use the latter to link the nodes in this example.
Step 3. Select Flowchart Shapes
Open Shape, choose a rounded rectangle, and drag on the canvas to create the start. Add a rectangle below it and a diamond below that. Add the approval outcome beneath the diamond, then the two correction rectangles to its right.
Keep the two action rectangles on the right the same width. Give the diamond enough room for a two-line question. Resize shapes with their corner handles; use a pale fill and a dark outline so text remains readable.
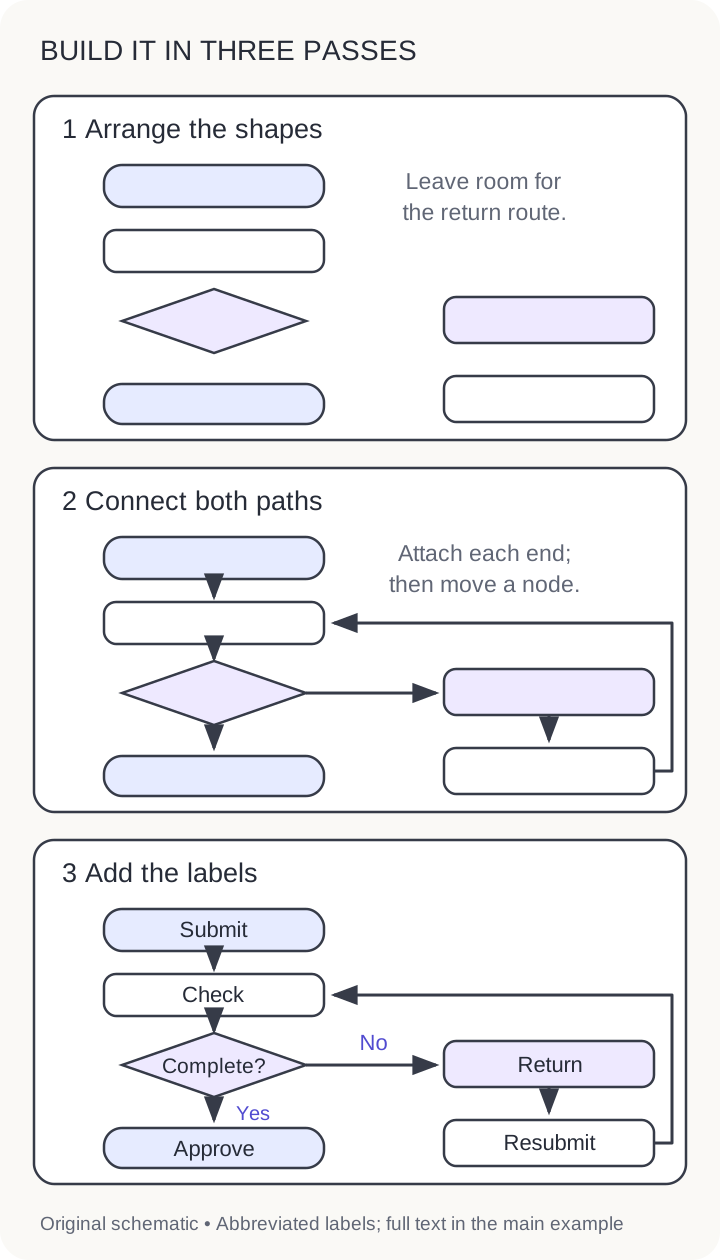
Do the layout before adding all the lines. It is easier to move six empty shapes into place than to untangle a finished diagram. The stage diagram below shows the order of work, not a toolbar or product screen.
Step 4. Add Arrows
Open the line menu and select an arrow or connector. Google lists Elbow Connector and Curved Connector among the available line types. For the straight central path, connect the start to the information check, then the check to the diamond and the diamond to approval.
Draw the second route from the diamond’s right edge to the corrections box, then to the resubmission box. Route the final connector around the outside and back to Check information, without crossing the approval node. Add arrowheads pointing in the direction the application moves.
When attaching a connector, look for the shape’s connection points and place each endpoint on one. Move a node a short distance as a check. If an endpoint stays behind, undo the move and reconnect that endpoint. A line that visually touches an outline is not sufficient proof that it is attached. Leave generous space around the diamond for the branch labels.
Step 5. Input Texts
Double-click inside each enclosed shape and type its label. Google documents this as a way to put text inside a shape; you do not need a separate text box over every node.
Use Text box for the two branch labels: put Yes beside the arrow toward approval and No beside the arrow toward corrections. Keep each label closer to its own line than to the other branch. A separately positioned text box may need to be moved again when you rearrange the chart.
Paste one label at a time from the table. Prefer short verbs, consistent text size, and centered node text. If a phrase does not fit, enlarge the shape or shorten the wording before shrinking the font.
Step 6. Save And Close
Choose Save and close in the drawing editor to place the chart in the document. Review it at the size your reader will see. A diagram that is readable only when the editor is enlarged needs larger labels or a simpler layout.
To revise an embedded drawing, select it and use Edit, or try double-clicking it to reopen the editor. Change Approve application to Approve and notify, widen that shape if needed, and save again. Recheck the connecting line and nearby labels after the change.
If the selected object instead offers linked-drawing controls, use the Drive workflow below. If it only behaves like a picture, return to the source diagram; image editing controls do not expose individual nodes.
Reuse a Google Drawing from Drive
For a chart used in more than one document, create a separate Google Drawings file in Drive. Google’s help describes creating it through New → More → Google Drawings. Build the same nodes there, then use Insert → Drawing → From Drive in each destination document.
After changing the source, select its linked drawing in Docs and use Update when available. Unlink breaks the connection to the original; do not use it if you want future source changes to remain available to that document.
Share the source drawing with people who need to change its shapes. Sharing the destination document is not a substitute for checking the source file’s permissions. Google’s Drive sharing guide distinguishes Viewer, Commenter, and Editor access; organization policies can also restrict sharing.
Troubleshooting your Google Docs flowchart
| Problem | Check | Practical fix |
|---|---|---|
| A line stays behind when a node moves | Is it a connector attached at both ends, or simply a line drawn nearby? | Reattach endpoints, move the shape a little, and confirm both ends follow before continuing. |
| The chart looks blurry or the labels are tiny | Was a small screenshot enlarged? Is the chart too dense for the page? | Return to the editable source, enlarge the text, and reduce the number of nodes shown together. Replace a low-resolution image from its source rather than enlarging it further. |
| A collaborator cannot change the diagram | Do they have Editor access? Is there a separate linked source? | Check the document and source drawing permissions separately. A picture has no editable node text to grant access to. |
| The imported diagram is one object | Was it inserted as an image? | Keep editing in its original tool, or rebuild it with native shapes. Do not expect PNG/JPEG insertion to recover the original objects. |
| The linked diagram shows old wording | Did the source change without refreshing the document’s copy? | Select the linked drawing and check for Update. Confirm that it has not been unlinked. |
| Yes/No labels drift away | Were labels placed in separate text boxes? | Move each label next to the correct branch after rearranging nodes. Read both routes from the diamond again. |
The connector movement test is a practical validation step, not a claim that every connector or imported object will preserve attachment. This guide does not rely on a Mermaid or complex-diagram import feature.
Can you make the same flowchart on a phone?
Use the desktop website for this shape-based workflow. Google’s mobile help pages do not document the same Drawing → New editor. The Android instructions describe pen/highlighter markups; the iPhone and iPad instructions describe showing, hiding, and deleting markups. Those features are different from arranging the editable nodes in this tutorial.
For a mobile handoff, include the process in ordinary document text as well as the diagram. Ask collaborators to make structural diagram edits on a computer. We have not tested a mobile browser’s desktop-site workaround or offline drawing creation, so neither is part of this guide.
Adapt the example to another workflow
Flowchart Example 1: Order Processing
Replace the start with Receive order, the check with Check stock, and the decision with In stock?. Make the No route explain what happens while stock is unavailable.
Flowchart Example 2: Decision Making
Use one explicit question per diamond. If both eligibility and budget matter, use two decisions rather than a vague Approved? with unexplained criteria.
Flowchart Example 3: Software Development Lifecycle
Use Review change → Tests pass? → Release / Revise for a small release handoff. A flowchart shows control flow; a sequence diagram instead shows interactions between participants. For implementation work, the existing laravel development services reference is a separate service resource, not a tool used or tested in this tutorial.
Flowchart Example 4: Project Management
Model a change request using Check scope → Within scope?. Include the person responsible for the next action in the surrounding document, so readers know who takes over.
Flowchart Example 5: Troubleshooting
Use an observable question such as Can the user sign in?. Give each No branch a specific check rather than a generic Try again loop with no stopping condition.
When another diagram tool makes sense
Stay in Docs when the chart is small and supports the surrounding writing. Use a separate Google Drawing when the same source needs to appear in several documents. For large branching processes, swimlanes, or frequent workshops, compare dedicated flowchart software against the actual diagram you need to maintain.
Publisher disclosure: this guide is published by AFFiNE. AFFiNE’s whiteboard is another place to explore processes alongside notes. Consider it when a wider visual workspace matters; it is not a way to turn a pasted image into native Google Docs shapes. For broader collaboration needs, see our Google Workspace alternatives guide.
Conclusion
Before sharing, read the diagram as if you were the applicant: submit, wait for the information check, then follow either approval or corrections and resubmission. Confirm that every branch has a label, the correction route returns to the check, and the chart can be reopened from its editable source. Keep a short text version beneath the diagram so the process remains understandable on small screens and with assistive technology.