Free Org Chart Templates: 5 Layout Types and How to Make One
Pick the layout before you pick the tool
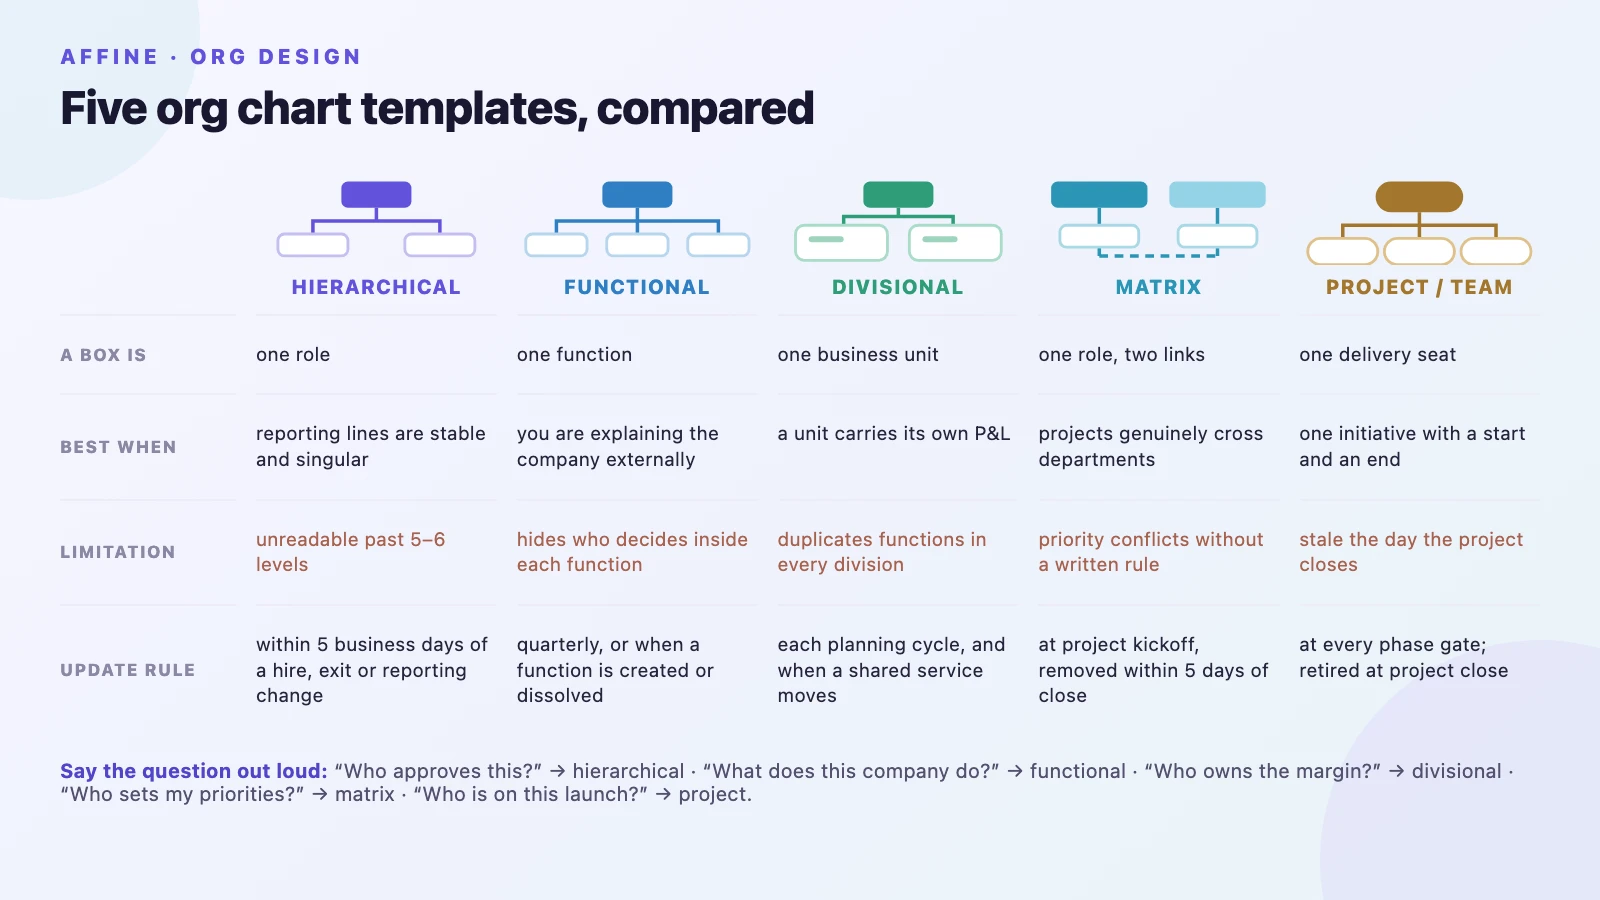
Choosing an org chart template is really one decision: what does a single box represent? A person, a function, a business unit, or a temporary project seat. Answer that and four of the five common layouts drop away immediately.
- Hierarchical — one box per role, one solid line up. The default, and the right answer most of the time.
- Functional — boxes are functions, not people. Good for explaining the company to outsiders without exposing headcount.
- Divisional — boxes are product lines, regions, or customer segments with their own P&L.
- Matrix — every role has a solid line plus a dotted, time-boxed one.
- Project / team — one delivery team, drawn for the length of the project and then retired.
Whichever you pick, the chart itself is the last step. Build the role table first — ID, title, department, reports-to, decision authority, backup, vacancy flag, verified-on date — and, for a small team, the drawing becomes the quick part.
If you want to start from an editable canvas instead of a blank page, open the organizational chart template and adapt the boxes and reporting lines to your own role table.
On this page: which template · the five layouts · the role table · worked example · chart vs. RACI vs. stakeholder map · how to build one · updates, privacy, accessibility · ownership review plan · sources and method · FAQ
Which org chart template should you use?
| Template | A box represents | Best when | Required fields | Known limitation |
|---|---|---|---|---|
| Hierarchical | one role | reporting lines are stable and singular | role ID, title, department, reports-to | becomes unreadable past five or six levels |
| Functional | one function | you are explaining the company externally | function name, purpose, lead role | hides who decides inside each function |
| Divisional | one business unit | product, region, or segment carries its own P&L | division, lead role, shared services used | duplicates the same functions in every division |
| Matrix | one role, two links | projects genuinely cross departments | solid line, dotted line, reason, end date | priority conflicts unless escalation is written down |
| Project / team | one delivery seat | a single initiative with a start and an end | seat, named person, allocation, end date | goes stale the day the project closes |
The fastest way to choose: say the question you actually need answered out loud. "Who approves this?" → hierarchical. "What does this company do?" → functional. "Who owns the margin?" → divisional. "Who sets my priorities this quarter?" → matrix. "Who is on this launch?" → project.
A note on the two that get misused. Functional charts are often chosen to avoid naming people, which is legitimate — but they cannot answer approval questions, so teams end up maintaining a second internal chart anyway. Matrix charts are often chosen because the company feels matrixed, not because a second reporting line actually exists on paper. If you cannot name the dotted line's reason and end date, you do not have a matrix; you have a hierarchical chart with a communication problem.
The five layouts, one by one
Hierarchical template
Use case: the default internal chart used for approvals, escalation, and onboarding. Fields: role ID, title, department, reports-to (exactly one), primary responsibility, decision authority, backup, vacancy flag, verified-on date. Limitation: legibility collapses above five or six levels. Split by department and keep one page per department rather than shrinking the type. Maintenance rule: update within five business days of a hire, exit, promotion, or change of reporting line.
Functional template
Use case: external-facing explanations, vendor onboarding, and RFP responses where headcount should not be published. Fields: function name, one-sentence purpose, accountable lead role, key interfaces. Limitation: cannot answer "who signs off". Do not let it become the only chart. Maintenance rule: review quarterly, or whenever a function is created or dissolved.
Divisional template
Use case: multi-product or multi-region organizations where each unit reports its own result. Fields: division, lead role, functions owned locally, shared services consumed centrally. Limitation: the same function appears three or four times, and the central-versus-local boundary is where the real ambiguity lives. Label it explicitly. Maintenance rule: update at each planning cycle and whenever a shared service moves in or out of a division.
Matrix template
Use case: organizations where a role genuinely takes direction from both a manager and a project or capability lead. Fields: everything in the hierarchical template, plus dotted-line target, reason, and end date. Limitation: without a written escalation rule, competing priorities are resolved by whoever asks loudest. The dotted line also does not imply performance review authority unless that is separately documented. Maintenance rule: create the dotted lines at project kickoff and remove them within five business days of project close.
Project / team template
Use case: one initiative — a launch, a migration, an audit response. Fields: seat, named person, allocation percentage, start and end date, escalation contact. Limitation: it is a snapshot, not a record. Archive it when the project ends instead of letting it drift. Maintenance rule: review at every phase gate; retire at project close.
The role table every template needs
Fill this in before you draw anything. Every layout above is a different rendering of the same rows. If the seat still lacks a clear purpose, outcomes, and decision boundaries, define its roles and responsibilities before publishing the reporting line.
| Field | Example | Required | Rule |
|---|---|---|---|
| Role ID | OPS-03 | yes | unique and stable even when the person changes |
| Title | Support Specialist | yes | the seat, never the person's name |
| Department | Operations | yes | match the wording HR uses, not a nickname |
| Reports to (solid) | OPS-02 | yes | exactly one per role |
| Dotted line | OPS-02, Atlas migration, ends 2027-03-31 | no | record the reason and the end date together |
| Primary responsibility | Handles tier 1 and tier 2 tickets | yes | one sentence, starting with a verb |
| Decision authority | Approves refunds up to $500 | recommended | a number or a boundary, not "operational matters" |
| Backup | OPS-04 | recommended | who covers during absence |
| Vacancy | no | yes | open seats stay on the chart |
| Verified on | 2026-08-01 | yes | ISO date |
| Verified by | ADM-07 | yes | a named role, not "HR" |
Two of these do most of the work. Decision authority is why people open the chart in the first place; a chart without it answers a question nobody asked. Vacancy is what keeps the chart honest — deleting an open seat makes the organization look like it has capacity it does not have.
Worked example: a fictional eight-role team
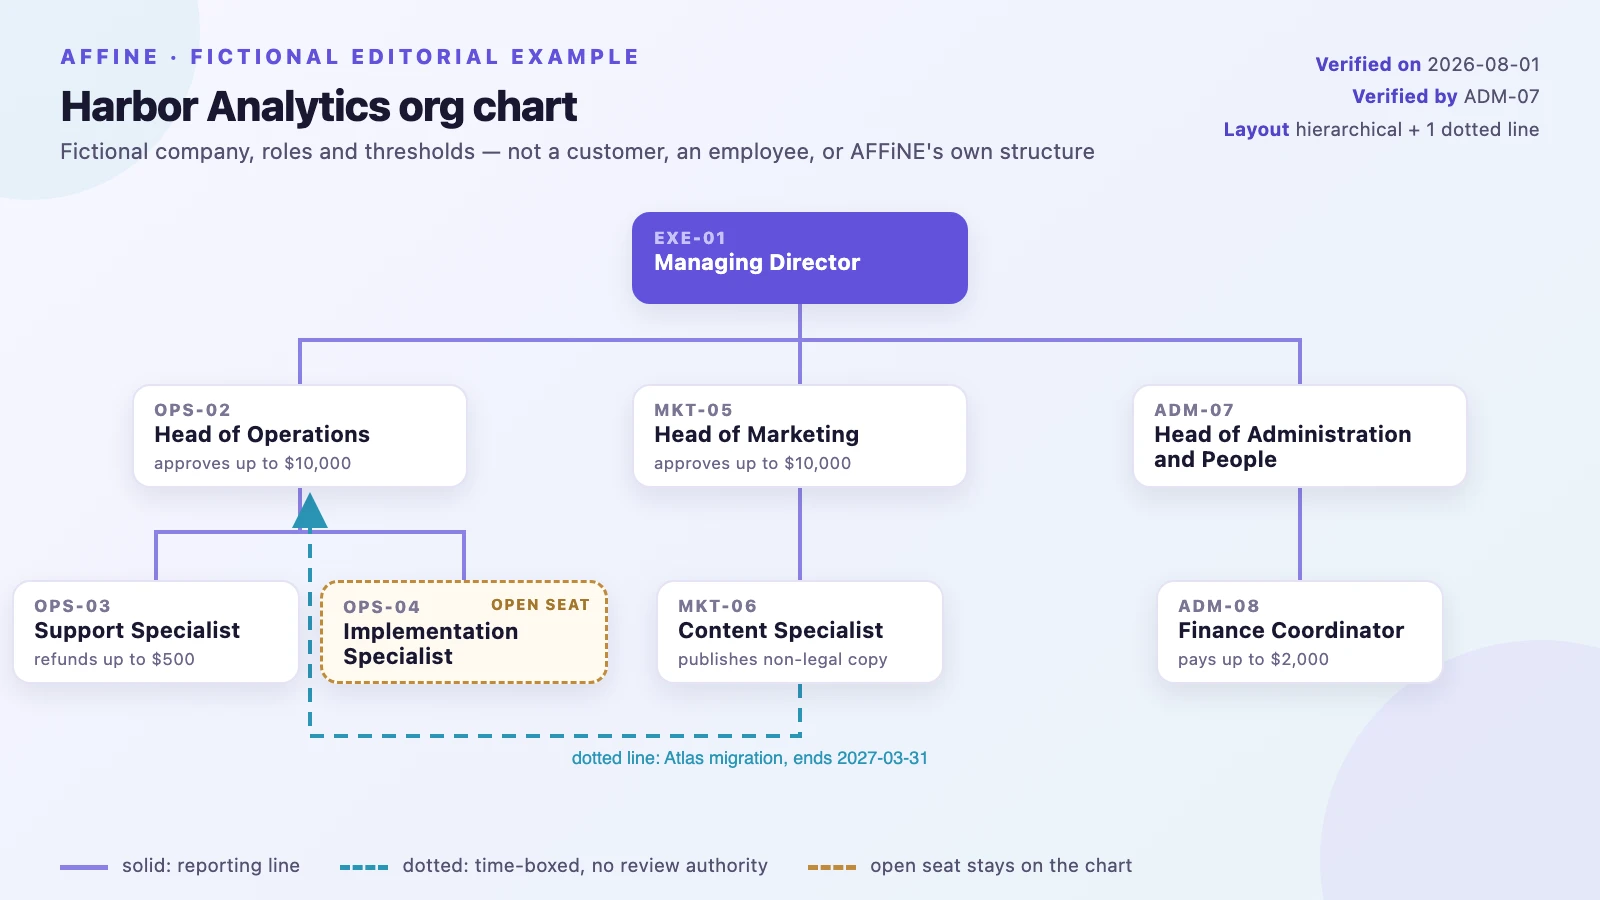
The chart below is a fictional editorial example. Harbor Analytics, the roles, the dollar thresholds, and the project name were written for this article. They do not represent AFFiNE customers, employees, or any real organization.
Harbor Analytics (fictional) — verified on 2026-08-01 — verified by: ADM-07 — layout: hierarchical, with one dotted line.
| Role ID | Title | Department | Primary responsibility | Reports to | Decision authority | Backup | Vacancy |
|---|---|---|---|---|---|---|---|
| EXE-01 | Managing Director | Executive | Approves the annual budget and targets | Board | Unlimited within approved budget | — | no |
| OPS-02 | Head of Operations | Operations | Owns delivery of active contracts | EXE-01 | Approves spend up to $10,000 | ADM-07 | no |
| OPS-03 | Support Specialist | Operations | Handles tier 1 and tier 2 tickets | OPS-02 | Approves refunds up to $500 | OPS-04 | no |
| OPS-04 | Implementation Specialist | Operations | Configures new customer environments | OPS-02 | Approves scope changes under 4 hours | OPS-03 | yes — open |
| MKT-05 | Head of Marketing | Marketing | Owns demand generation | EXE-01 | Approves spend up to $10,000 | EXE-01 | no |
| MKT-06 | Content Specialist | Marketing | Produces and publishes site material | MKT-05 | Approves publishing of non-legal copy | MKT-05 | no |
| ADM-07 | Head of Administration and People | Administration | Owns contracts, payroll, and the role register | EXE-01 | Approves spend up to $10,000 | EXE-01 | no |
| ADM-08 | Finance Coordinator | Administration | Processes payables and receivables | ADM-07 | Executes approved payments up to $2,000 | ADM-07 | no |
The one dotted line: for the fictional "Atlas migration" running through 2027-03-31, MKT-06 takes day-to-day priorities from OPS-02. The solid line to MKT-05 does not move — pay, review, and time off stay where they were. If the two priorities collide, EXE-01 decides in the weekly meeting.
Three things this example does that most published charts skip: it shows an open seat rather than hiding it, it puts dollar thresholds next to the roles that need them, and it gives the dotted line an end date so it cannot quietly become permanent.
Org chart vs. RACI vs. stakeholder map vs. process map
| Artifact | Question it answers | Smallest unit | Sign you picked wrong |
|---|---|---|---|
| Org chart | who reports to whom, and who approves what? | role | you are writing process steps inside the boxes |
| RACI matrix | who is responsible, accountable, consulted, informed for this deliverable? | deliverable × role | one role is "responsible" for everything |
| Stakeholder map | who is affected, how much influence and interest do they have? | stakeholder | you are drawing internal reporting lines on it |
| Process map | in what order does work happen, and where are the decisions? | step and decision | you needed a diamond to represent a person |
A related trap worth naming: an org chart is not a navigation model. When teams build an internal wiki, copying the org chart into the sidebar produces a structure that matches the company rather than the reader's task. The internal knowledge base examples guide covers that failure mode in more detail; the short version is that people search for "how do I request a laptop", not for "Administration → Facilities".
For choosing a drawing tool rather than a layout, the chart maker guide covers the general trade-offs across chart types.
How to build and publish one
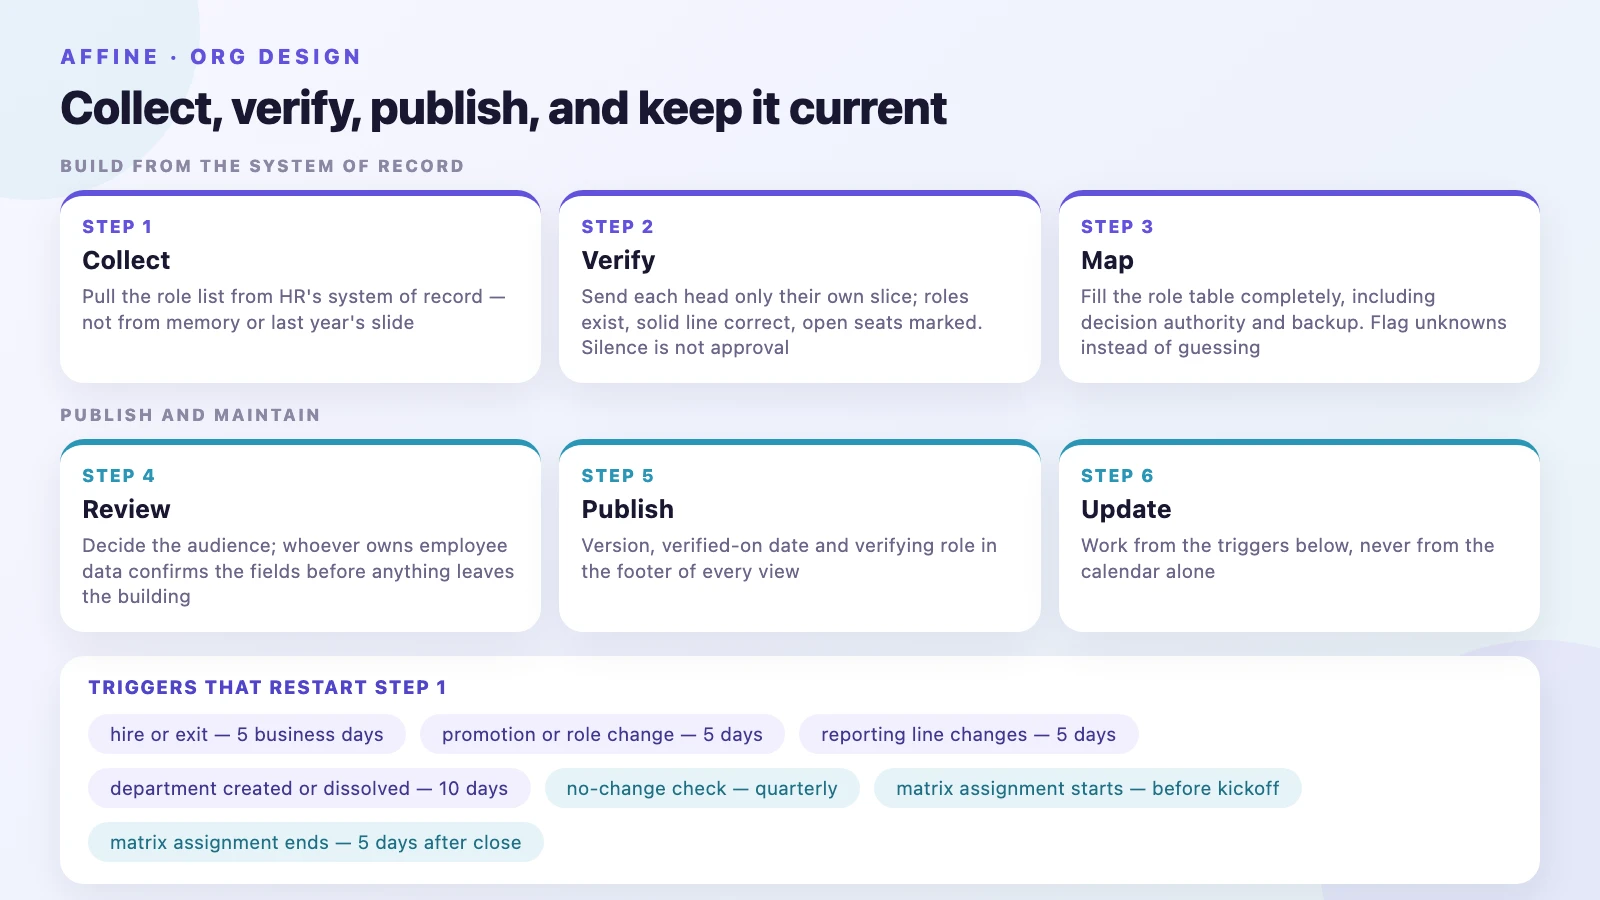
- Collect. Pull the role list from HR's system of record. Do not start from memory or from last year's slide.
- Verify. Send each department head only their own slice and ask for three explicit confirmations: the roles exist, the solid line is correct, and open seats are marked. Silence is not approval.
- Map. Fill in the role table completely, including decision authority and backup. Flag unknowns rather than guessing them.
- Review. Decide the audience. An internal chart may carry names; a published one usually should not. Have whoever owns employee data confirm the fields before anything leaves the building.
- Publish. Put version, verified-on date, and verifying role in the footer of every view. Without those three, a reader cannot tell whether they are looking at today's structure or last year's.
- Update. Work from triggers, not from the calendar. The trigger list is in the next section.
Government practice mirrors this. OPM's reorganization support describes helping agencies "prepare supporting materials for reorganization communications, including organization charts" as part of "establishing future structures and transitioning current staff into those positions" (U.S. Office of Personnel Management, Reorganization Support, accessed August 22, 2026) — that is, the chart is an output of a structural decision, not a substitute for making one. OPM's broader workforce reshaping material sits in the same place (accessed August 22, 2026). Federal agencies also publish their structures openly; the GSA organization pages are one example of a maintained public org structure (accessed August 22, 2026).
Update triggers, privacy, and accessibility
Triggers
| Trigger | Deadline | Who updates | Who approves |
|---|---|---|---|
| Hire or exit | 5 business days | HR | department head |
| Promotion or role change | 5 business days | HR | department head |
| Change of reporting line | 5 business days | HR | executive |
| Department created or dissolved | 10 business days | HR | executive |
| Matrix assignment starts | before kickoff | project lead | executive |
| Matrix assignment ends | 5 business days after close | project lead | executive |
| Periodic check with no changes | quarterly | HR | all department heads |
Privacy
Names, photos, work email addresses, and employee numbers are personal data. Two practical rules cover most cases: the published version carries departments and titles only, and the internal version may carry names but has no reason to carry birth dates, home addresses, salary bands, or health information. An out-of-date chart is also inaccurate personal data, which is a second reason to keep the deadlines above. Decisions about what may be published, and to whom, belong to your HR, legal, and data-protection functions — this section describes common practice, not legal advice.
Accessibility
The W3C classifies org charts as complex images, alongside flow charts. The requirement is a two-part text alternative: a short description that identifies the image, plus a long description that is "a textual representation of the essential information conveyed by the image" (W3C WAI, Complex Images, accessed August 22, 2026). WCAG 2.1 success criterion 1.4.1 separately requires that color not be the only way information is conveyed (W3C, WCAG 2.1, accessed August 22, 2026).
In practice that means three things. The alt text identifies the image in one sentence and the full structure lives in a table on the same page — which is why every figure here is paired with one. Solid and dotted lines differ by line style, not only by color. And when the chart is pasted into a slide deck or a wiki page, the table travels with it.
Ownership review plan: day 28
This page and the organizational chart template deliberately target different intents. The template page owns the transactional intent — someone who wants to open an editable canvas and start placing boxes. This page owns the comparison and how-to intent — someone still deciding which layout to use and what fields to collect.
To make sure that split holds in practice rather than in theory, the plan is to re-check query-to-page ownership for org chart, organizational chart, and org chart template 28 days after this page goes live. If the template page starts absorbing generic informational queries, the fix is to adjust internal linking and the angle of this page — not to add a redirect, a cross-canonical, or a second product-template owner.
Two honesty notes about that plan. First, it is a monitoring commitment, not something already completed. Second, Search Console filters low-volume rows and labels its totals as partial, so those numbers are usable for deciding which page owns a query and not usable as a traffic forecast.
Sources, method, and update criteria
Demand research — with two open gates. The US SERP for org chart template was re-read on August 22, 2026. The dominant intent combines layout comparisons, editable-template entry points, and a short how-to. This page compares the layouts, then points to AFFiNE's single editable organizational chart template. The Ahrefs figures available to this draft (SV 3.2K, KD 0, TP 4.1K) are an August 21, 2026 snapshot, not a same-day pull, and the Search Console ownership check behind this page's positioning is also from that earlier snapshot. Both are reported here as dated snapshots. Re-pulling US volume and difficulty and re-running the Search Console query-to-page check on the publishing day remain open items for review.
Why the example is fictional. Harbor Analytics, the roles, the thresholds, and the project were written for this article. Publishing a real structure would expose third-party employee information and would not be verifiable by readers. A complete fictional example is more useful than a real one with half its boxes redacted.
Product verification scope. Statements about AFFiNE are limited to what the product pages describe: an editable org chart template on an infinite canvas with boxes and reporting lines, page documents in the same workspace, real-time collaboration, and switching between page and canvas. We make no claim about sign-in requirements, export formats, downloadable .pptx or .xlsx files, automatic generation from a spreadsheet, or synchronization with an HR system, because we did not verify any of those.
Sources consulted (all accessed August 22, 2026):
- U.S. Office of Personnel Management, Reorganization Support — org charts as an output of structural decisions.
- U.S. Office of Personnel Management, Workforce Reshaping — the surrounding restructuring guidance.
- U.S. General Services Administration, GSA organization — a maintained public organizational structure.
- W3C Web Accessibility Initiative, Complex Images — two-part text alternatives.
- W3C, WCAG 2.1 — success criterion 1.4.1 on the use of color.
When this page will be updated. If search intent shifts, if the OPM or W3C material referenced here changes, or if the AFFiNE capabilities named here change, we will update the text and correct the date. This is AFFiNE editorial content: we have a commercial interest in the product mentioned, which is why product claims are limited to what we could verify.
FAQ
What is an org chart template?
It is a reusable layout for showing roles and reporting lines, paired with the data behind it: role ID, title, department, who each role reports to, decision authority, backup, vacancy status, and a verified-on date. The layout is only half the template; without the role table, the drawing cannot be kept accurate.
Which org chart template should I use?
Decide what one box represents. A role means hierarchical, a function means functional, a business unit with its own result means divisional, a role with two reporting relationships means matrix, and a single initiative means a project or team chart. If you cannot name a dotted line's reason and end date, you do not need the matrix layout.
What information goes in an org chart?
At minimum: role ID, title, department, the single solid reporting line, and a verified-on date. Add decision authority — a dollar limit or an explicit boundary — because that is what most readers actually open the chart to find. Mark open seats instead of deleting them, and record who verified the data.
How often should an org chart be updated?
By trigger rather than by calendar: hires, exits, promotions, and reporting-line changes within five business days; departments created or dissolved within ten; matrix assignments at kickoff and within five business days of project close. Add a quarterly check even when nothing changed, so the stated structure is confirmed rather than assumed.
Can you put employee names on an org chart?
On an internal chart, often yes, with the appropriate basis for handling employee data. On a published chart, usually no — departments and titles are enough, and they age far more slowly than names. In either case there is no reason to include birth dates, home addresses, salary bands, or health information, and an out-of-date chart counts as inaccurate personal data.