Grade Calculator: Find Your Current Grade, Final Exam Score & GPA
A grade calculator answers three questions: what your grade is right now, what score you need on the final exam, and what your GPA will be. Current grade = the sum of each category score × its weight, divided by the weight already graded. Score needed on the final = (target − current grade × (1 − final weight)) ÷ final weight. GPA = total quality points ÷ total GPA credits. Use the free spreadsheet below or follow the worked examples to do each one by hand.
Reviewed by Allen, AFFiNE content team. Updated September 29, 2026. The formulas were checked against university registrar guidance, Canvas and Google Classroom help documentation, and AFFiNE's editorial policy. Every number in the examples comes from one fictional course. The downloadable workbook was recalculated in a spreadsheet app to confirm those outputs before publication. Your syllabus and your school's official gradebook always take priority over any calculator.
Quick Answer: The Three Grade Formulas
| You want to know | Formula | Example result |
|---|---|---|
| Current grade | Σ(score × weight) ÷ weight graded | 84.9% (B) |
| Final exam score needed | (target − current × (1 − w)) ÷ w | 68.7% for an 80% |
| GPA | Σ(grade points × credits) ÷ GPA credits | 3.45 |
w is the final exam weight as a decimal. For example, a final worth 30% has w = 0.30.
If a result is above 100%, the target can't be reached without extra credit or a curve. If it is 0% or below, you have already secured that grade.
Download the Free Grade Calculator Spreadsheet
- Download the grade calculator workbook (XLSX): Works in Excel, Google Sheets, and Numbers. Includes weighted-grade, final-exam, GPA, and editable grade-scale tabs. Every result is a live formula.
- Download the blank grade log (CSV): Column headers only, for logging each assignment as it is returned.
- Download the example grade log (CSV): The fictional Biology I course used throughout this guide.
Yellow cells are inputs and blue cells are formulas. Change the Grade Scale tab to match your school, and the letter grades and GPA points on every other tab update with it. In Google Sheets, open the XLSX from Drive or use File → Import; the formulas use only standard functions (SUM, SUMIFS, VLOOKUP, INDEX/MATCH, COUNTIF).
Which Grade Calculator Do You Need?
"Grade calculator" covers several different jobs. Pick the one that matches your question:
| Your question | Calculator type | What you need |
|---|---|---|
| "What's my grade now?" | Weighted or points grade | Scores + syllabus weights |
| "What do I need on the final?" | Final grade calculator | Current grade, final weight, target |
| "How much will this test move my grade?" | What-if / test grade | Current grade + one hypothetical score |
| "What's my GPA?" | GPA calculator | Letter grades + credit hours |
| "What does 87% mean?" | Grade scale | Your school's cut-offs |
How to Calculate Your Current Grade
First find out how your course is graded. The syllabus will use one of two systems, and each needs a different calculation.
Total-points courses
If every assignment is worth a number of points and nothing is weighted, your grade is simply:
Grade % = points earned ÷ points possible × 100
For example, if you have earned 412 of the 480 points graded so far, your grade is 412 ÷ 480 × 100 = 85.8%. Google Classroom describes its total-points method the same way: total points earned divided by total points possible.
Weighted-category courses
Most high school and college syllabi weight categories instead. The fictional Biology I syllabus used in this guide weights homework 15%, quizzes 20%, lab reports 15%, the midterm 20%, and the final exam 30%.
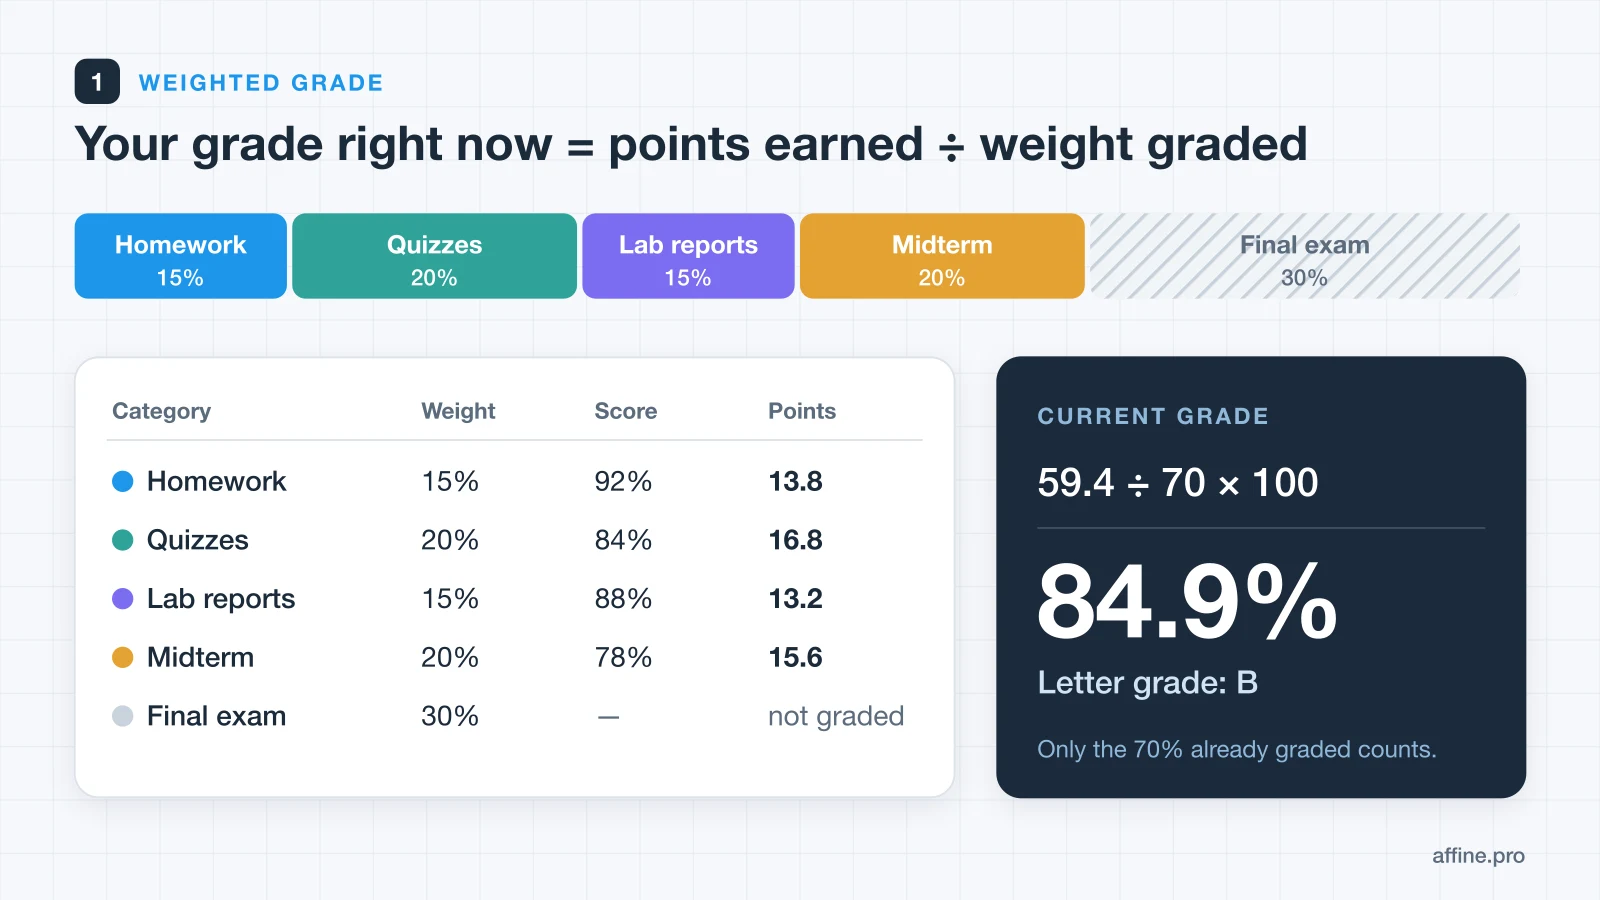
- Turn each category into a percentage. Average the scores inside the category, or divide points earned by points possible in it. In the example, homework is 92%, quizzes 84%, lab reports 88%, and the midterm 78%.
- Multiply each category score by its weight. 92 × 0.15 = 13.8; 84 × 0.20 = 16.8; 88 × 0.15 = 13.2; 78 × 0.20 = 15.6.
- Add the products. 13.8 + 16.8 + 13.2 + 15.6 = 59.4 weighted points.
- Divide by the weight that has been graded. Only 70% of the course has been graded so far, so 59.4 ÷ 0.70 = 84.9%, a B on a standard plus/minus scale.
Step 4 is where most homemade calculators go wrong. If you divide by 100% instead of 70%, your grade looks like 59.4%, as if you had scored zero on a final you haven't taken yet.
Why your grade moves so much early in the term
When only a few categories have been graded, each score carries more of your current grade. By default, Canvas calculates the current grade from graded assignments only. Its student guide says the Calculate based only on graded assignments checkbox is selected by default. Clearing that box shows your total grade with ungraded work counted as well. UW-Madison's Canvas knowledge base shows that two setups with the same final weights can display different current grades mid-term, depending on how assignments are grouped. Treat early-term numbers as a trend, not a verdict.
How to Calculate the Final Exam Score You Need
This is the question most people have when they search for a grade calculator. You need three numbers: your current grade, the final exam's weight, and the course grade you want.
Score needed on final = (target − current × (1 − w)) ÷ w
Step by step:
- Calculate your current grade. Multiply each graded category score by its weight, add the products, and divide by the total weight already graded. Example: 59.4 weighted points ÷ 0.70 = 84.9%.
- Find the final exam weight. Check the syllabus for the percentage of the course grade the final exam is worth and convert it to a decimal, such as 30% = 0.30.
- Choose your target course grade. Pick the minimum course percentage you want, using your syllabus grade scale, such as 80% for a B-.
- Solve for the score needed. Score needed = (target − current × (1 − final weight)) ÷ final weight. Example: (80 − 84.86 × 0.70) ÷ 0.30 = 68.7%.
- Check your floor and ceiling. Calculate your course grade with 0 and with 100 on the final. If the score needed is above 100%, the target is out of reach without extra credit or a curve.
The same calculation for three targets in the Biology I example (current grade 84.9%, final worth 30%):
- To finish with 80% (B-): (80 − 84.86 × 0.70) ÷ 0.30 = (80 − 59.4) ÷ 0.30 = 68.7%
- To finish with 83% (B): (83 − 59.4) ÷ 0.30 = 78.7%
- To finish with 90% (A-): (90 − 59.4) ÷ 0.30 = 102%, which is out of reach without extra credit
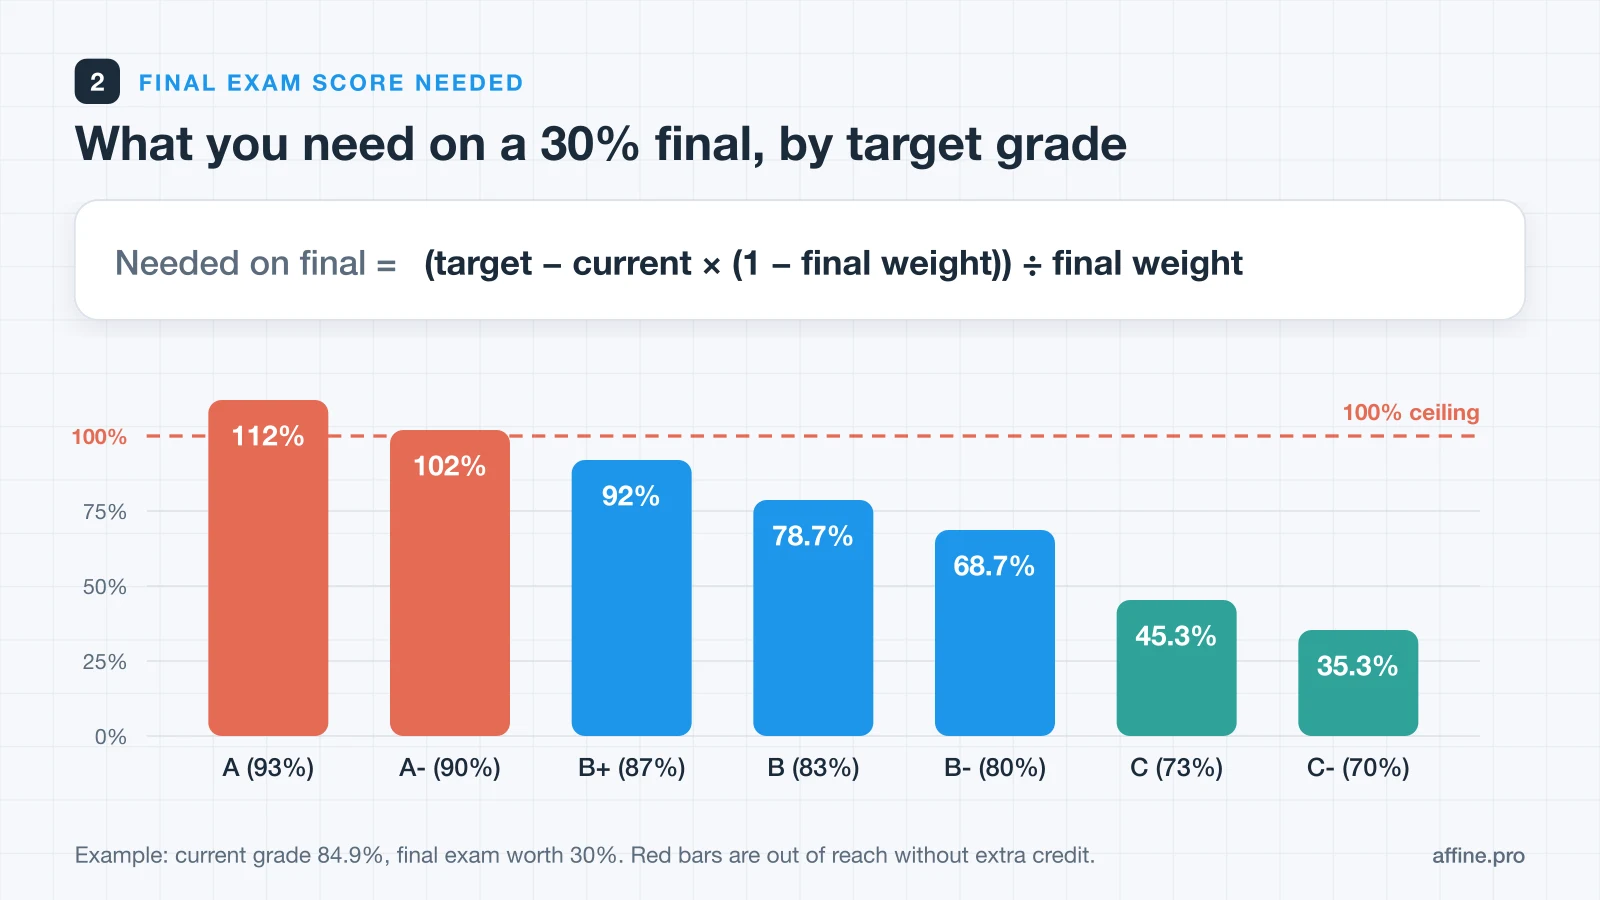
Also work out your floor and ceiling. A 0 on the final would leave this student at 59.4%, and a perfect 100 would bring them to 89.4%. An A-minus is out of reach before the exam starts, so the useful plan is to lock in a B and then push for a B+ (which needs 92%).
| Target | Needed on the final | Verdict |
|---|---|---|
| A- (90%) | 102.0% | Out of reach |
| B+ (87%) | 92.0% | Reachable, stretch goal |
| B (83%) | 78.7% | Reachable |
| B- (80%) | 68.7% | Reachable |
| C (73%) | 45.3% | Reachable |
If your final replaces a lower score (some instructors let the final replace the midterm), or if the final is split into written and practical parts, the one-line formula no longer applies. Enter the scenario in your LMS's what-if tool or the workbook's Weighted Grade tab instead.
How Much Will One Test Change Your Grade?
Use the same weighted math for any single upcoming assessment. A test's effect on your grade equals its weight × (test score − your current grade in the course).
In the example, suppose the midterm had not been graded yet and you expected a 90 instead of a 78. That 12-point difference × 0.20 weight = 2.4 more weighted points. Divided by the 70% graded so far, it would add about 3.4 percentage points to the current grade.
Canvas offers this as What-If grades. Students can enter hypothetical scores for graded or ungraded assignments, see the total update, and use Revert to Actual Score afterward, according to Instructure's student guide. The same guide notes that instructors can hide current or final grades, in which case the What-If total won't show.
Convert a Percentage to a Letter Grade
There is no universal grade scale. The table below is a common US plus/minus scale on a 4.0 system and the default in the free workbook. Always check your syllabus: many courses use 90/80/70/60 without plus/minus grades, and some schools award 4.33 for an A+.
| Percentage | Letter | Grade points |
|---|---|---|
| 93–100 | A | 4.00 |
| 90–92.99 | A- | 3.67 |
| 87–89.99 | B+ | 3.33 |
| 83–86.99 | B | 3.00 |
| 80–82.99 | B- | 2.67 |
| 77–79.99 | C+ | 2.33 |
| 73–76.99 | C | 2.00 |
| 70–72.99 | C- | 1.67 |
| 60–69.99 | D range | 0.67–1.33 |
| Below 60 | F | 0.00 |
Rounding matters at the boundary. Whether 89.5% becomes an A- depends on your instructor's policy. Registrars can be strict too: the University of Illinois registrar says the GPA on its official transcripts shows two decimal places and is "truncated, not rounded."
How to Calculate Your GPA
A GPA calculator turns letter grades into one number weighted by credit hours. Registrar offices use the same method.
- Convert each letter grade to grade points using your school's scale (for example B+ = 3.33).
- Multiply grade points by the course's credit hours to get quality points.
- Add the quality points and add the GPA credits, leaving out pass/fail, credit/no-credit, and withdrawn courses.
- Divide total quality points by total GPA credits.
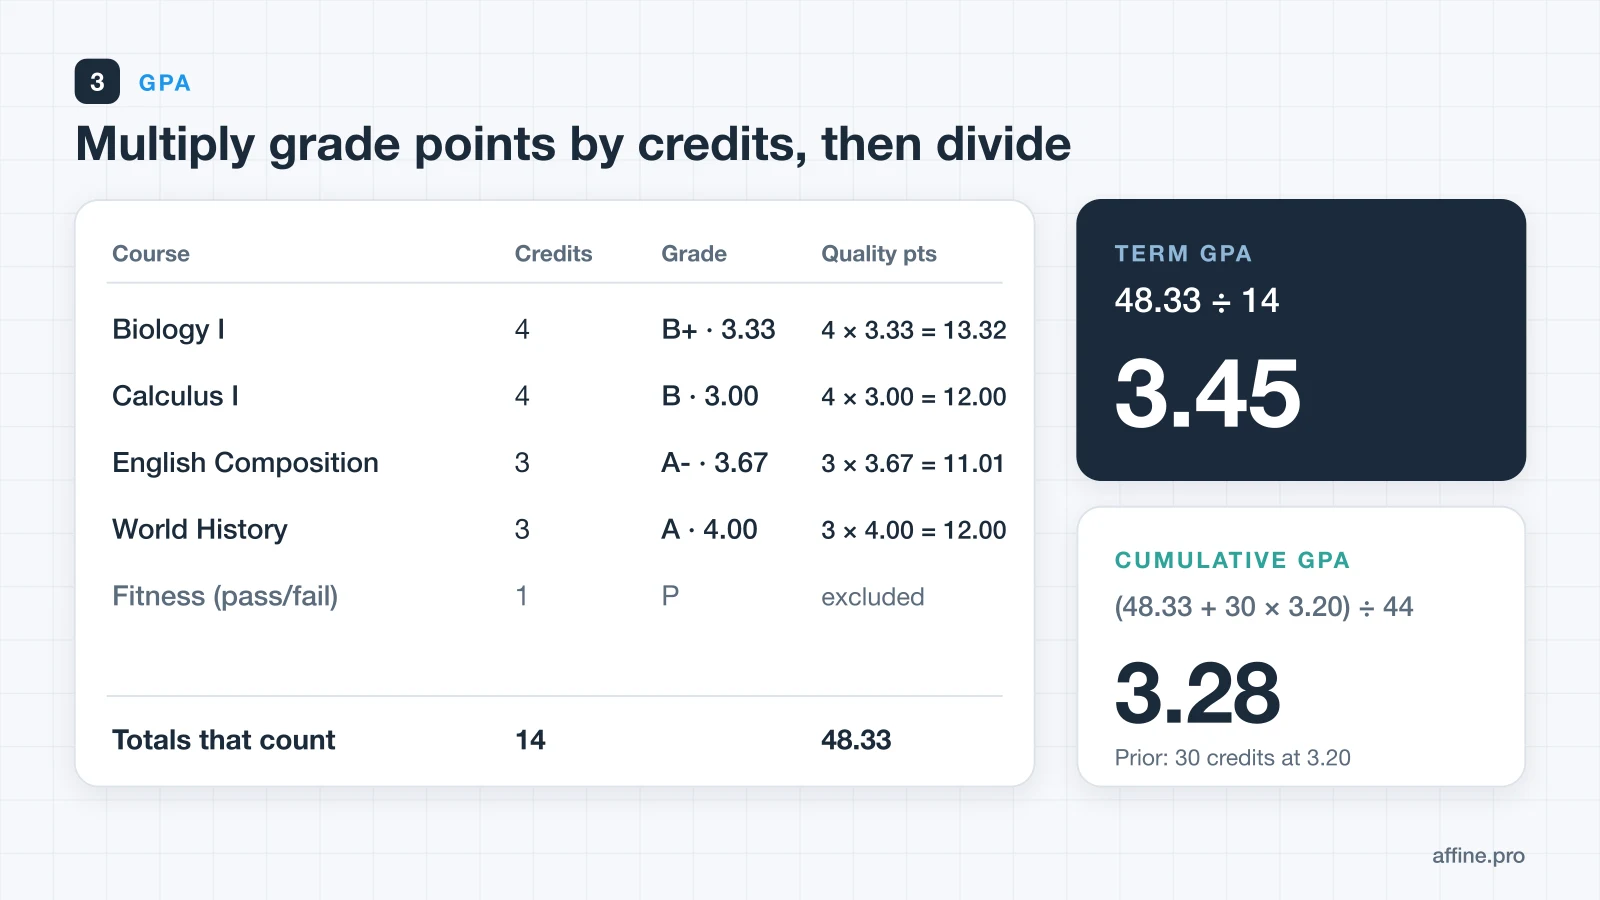
In the example term, Biology I (4 credits, B+), Calculus I (4, B), English Composition (3, A-), and World History (3, A) give 48.33 quality points over 14 credits, so the term GPA is 3.45. The 1-credit pass/fail fitness course is left out.
Cumulative GPA and target GPA
- Cumulative GPA = (prior quality points + new quality points) ÷ (prior credits + new credits). With 30 prior credits at 3.20 (96.0 quality points), the new cumulative GPA is (96.0 + 48.33) ÷ 44 = 3.28.
- GPA needed next term = (target GPA × total credits after next term − current quality points) ÷ next-term credits. To reach a 3.30 cumulative GPA after 15 more credits, this student needs (3.30 × 59 − 144.33) ÷ 15 = 3.36 next term.
Cumulative GPA moves slowly. The more credits you already have, the more strong semesters it takes to raise it, so check whether a scholarship or program threshold is realistic before you plan around it.
Weighted vs. unweighted GPA
High schools often report a weighted GPA that adds extra points for honors, AP, IB, or dual-enrollment courses, commonly +0.5 or +1.0. An unweighted GPA ignores course level and tops out at 4.0. The bonus varies by district and colleges may recalculate your GPA, so check your school profile or counselor's guidance before you compare numbers.
Why Your Number Doesn't Match the Gradebook
If your calculator and the official gradebook disagree, one of these is usually the reason:
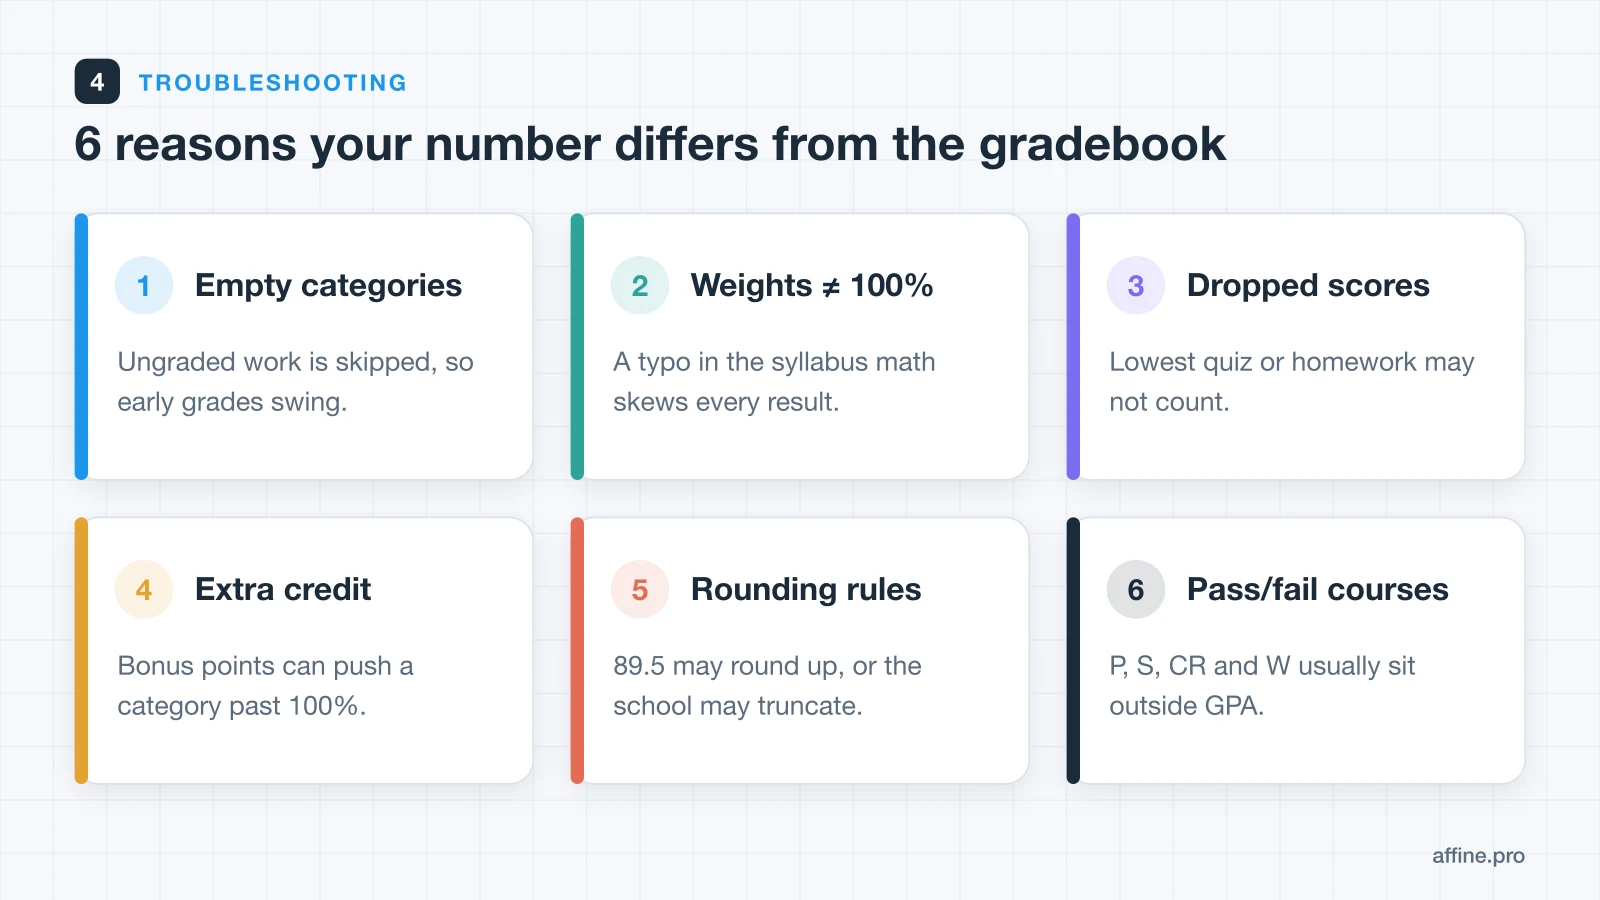
- Empty categories. Ungraded work is excluded from the current grade, so an early 60% quiz can dominate.
- Weights that don't add to 100%. Add up the syllabus weights before you trust any result. The workbook flags this automatically.
- Dropped scores. "Lowest quiz dropped" means that quiz shouldn't be in your category average.
- Extra credit. Bonus points can push a category above 100%, or be added to the course total instead.
- Rounding and truncation. Your instructor may round 89.5 up, or may not round at all.
- Excluded courses. Pass/fail, credit/no-credit, withdrawals, and sometimes repeated courses don't count toward GPA.
- Averaging averages. If a category is scored by total points, don't average the individual percentages. A 10-point quiz and a 50-point quiz shouldn't count equally.
Grade Calculator Options Compared
| Tool | Best for | Watch out for |
|---|---|---|
| Canvas What-If | Courses already in Canvas | Hidden totals, grade groups |
| Google Classroom | Class-level overall grade | Teacher must show the grade |
| Online calculators | One quick calculation | No saved history |
| This spreadsheet | A whole term and GPA | You maintain the inputs |
Web calculators such as RapidTables and RogerHub's final grade calculator are fast for a single check. Google Classroom Help explains that teachers choose total-points or weighted-category grading, or turn off the overall grade entirely. That setting controls what students see. A spreadsheet is the better fit when you want one file for every course, the term's history, and your GPA.
Turn the Number into a Study Plan
A grade calculator is only useful if the result changes what you do next. A simple weekly routine:
- Log new scores the day they come back. Use the grade log CSV or the Weighted Grade tab.
- Run the final-exam check once a week during the last month of the term, not the night before the exam.
- Pick the highest-leverage category. A 10-point gain in a 30% final is worth three times as much as the same gain in 10% homework.
- Book study blocks for that category and keep them next to your deadlines.
If you already keep class notes in AFFiNE, you can keep this plan in the same workspace. Paste the syllabus weights into a page, track assignments in a database table (see our assignment tracker guide), and link your study guides to the category you are trying to raise. AFFiNE doesn't calculate grades for you, so keep the math in the spreadsheet and the plan in your notes.
Frequently Asked Questions
How do I calculate my grade with weighted categories?
Multiply each category's percentage score by its weight, add the results, and divide by the total weight of the categories that have been graded. For example, 59.4 weighted points across 70% of graded weight is 59.4 ÷ 0.70 = 84.9%.
What score do I need on my final exam to pass?
Use (target − current × (1 − w)) ÷ w, where w is the final's weight as a decimal. With a current grade of 84.9% and a 30% final, you need 2% to finish at 60% and 35.3% to finish at 70%. Check your syllabus too, because some courses require passing the final itself regardless of your course average.
How much is a final exam worth?
There is no standard weight; it is set in each course syllabus, and some courses don't have a cumulative final at all. In this guide's example it is 30%. The bigger the weight, the more the final can raise or lower your grade, so check the syllabus before you run any final-exam calculation.
Is 89.5% an A or a B?
It depends on your instructor's rounding policy. On a scale where an A- starts at 90%, 89.5% is a B+ unless your instructor rounds to the nearest whole percent. Check the syllabus, and ask before the final if it isn't stated.
How do I calculate my GPA from percentages?
Convert each course percentage to a letter grade using your school's scale, convert the letter to grade points, multiply by credit hours, add the quality points, and divide by total GPA credits. The workbook's Grade Scale tab handles the conversion automatically.
Why is my Canvas grade different from my own calculation?
Canvas may be leaving out ungraded assignments, applying assignment-group weights, dropping low scores, or using a what-if score you forgot to revert. Compare the syllabus weights with the grade breakdown on the Canvas Grades page, and ask your instructor if the difference remains.
Can I use this grade calculator in Google Sheets?
Yes. Open the XLSX from Google Drive or import it with File → Import. The formulas use standard spreadsheet functions and recalculate as soon as you edit a yellow input cell.
Sources and Verification
This guide and the downloadable workbook were checked on September 29, 2026.
- University of Illinois Office of the Registrar: Calculate your GPA: quality points, GPA hours, excluded grades, and truncation.
- Instructure Community: How do I approximate my assignment scores using the What-If Grades feature?: What-If scores, graded-only calculations, and instructor restrictions.
- UW-Madison KB: Canvas grade calculation fluctuates when using weighted assignment groups: why mid-term current grades differ between weighting setups.
- Google Classroom Help: Set up grading: total-points, weighted-by-category, and no-overall-grade options.
The Biology I course, its scores, and the GPA transcript are fictional teaching examples. The workbook's weighted-grade, final-exam, GPA, and grade-scale outputs above were recalculated from the XLSX before publication.