How to Make a Bar Graph in 4 Steps (With an Example)
Quick answer: Put category names in one column and their numbers in the next. Select both columns, insert a bar chart, then check that every bar matches its number, the value axis starts at zero, and the title and axis label say what was counted. A bar graph compares categories by the length of their bars; horizontal bars work well when category names are long.
This guide follows one small dataset from table to finished chart, by hand or in Excel, Google Sheets, Google Docs, Word, PowerPoint, or Python. If you already know your tool, jump to its steps.
Still choosing a tool? Our comparison of free bar graph makers covers Google Sheets, Excel, Canva, RapidTables and three more, checked on each vendor's site.
Start with a two-column table
A class asked 20 students to pick one favorite fruit:
| Fruit | Students |
|---|---|
| Apples | 8 |
| Bananas | 6 |
| Oranges | 4 |
| Pears | 2 |
The four counts add up to 20. Fruit is the category, and Students is the value, measured in number of students. Plot these counts directly; you do not need a percentage column. If your data starts as raw survey responses, tally and clean the responses first.
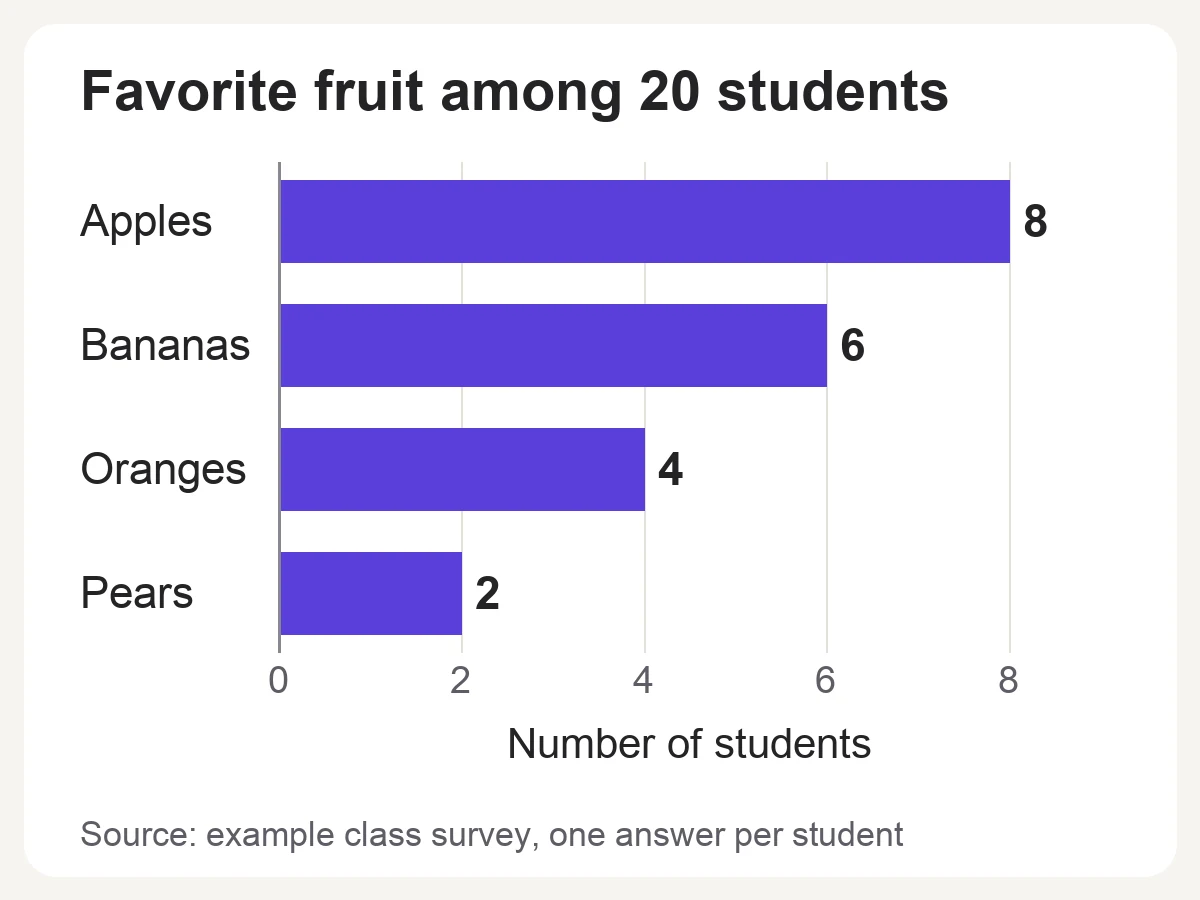
The finished example: one bar per fruit, a value axis that starts at zero, and the exact count at the end of each bar. The survey data is illustrative.
Make a bar graph in four steps
- Pick one category and one measure. Put labels in the first column and numbers in the second. Name the unit, such as students, dollars, or minutes.
- Select the whole table, including the headings, and insert the chart. Choose a bar chart for horizontal bars or a column chart for vertical bars.
- Check the result against the table. You should see four bars, one per fruit, each matching its count and in the order you intended. Fruit names go on one axis and counts on the other, and the count axis should start at zero.
- Label it. Add a title that says what was measured, an axis label with the unit, and value labels if readers need exact numbers. Delete a legend that only repeats the category names, and add a source note if you share the chart.
For this dataset, Favorite fruit among 20 students is a useful title and Number of students is a useful axis label. A title like "Results" leaves readers guessing.
Bar or column: which should you pick?
Both show the same comparison. In Excel, Word, PowerPoint, and Google Sheets menus, bar means horizontal and column means vertical. Use horizontal bars when labels are long or you are showing a ranking; use columns when short labels fit along the bottom. Switching orientation does not change the data.
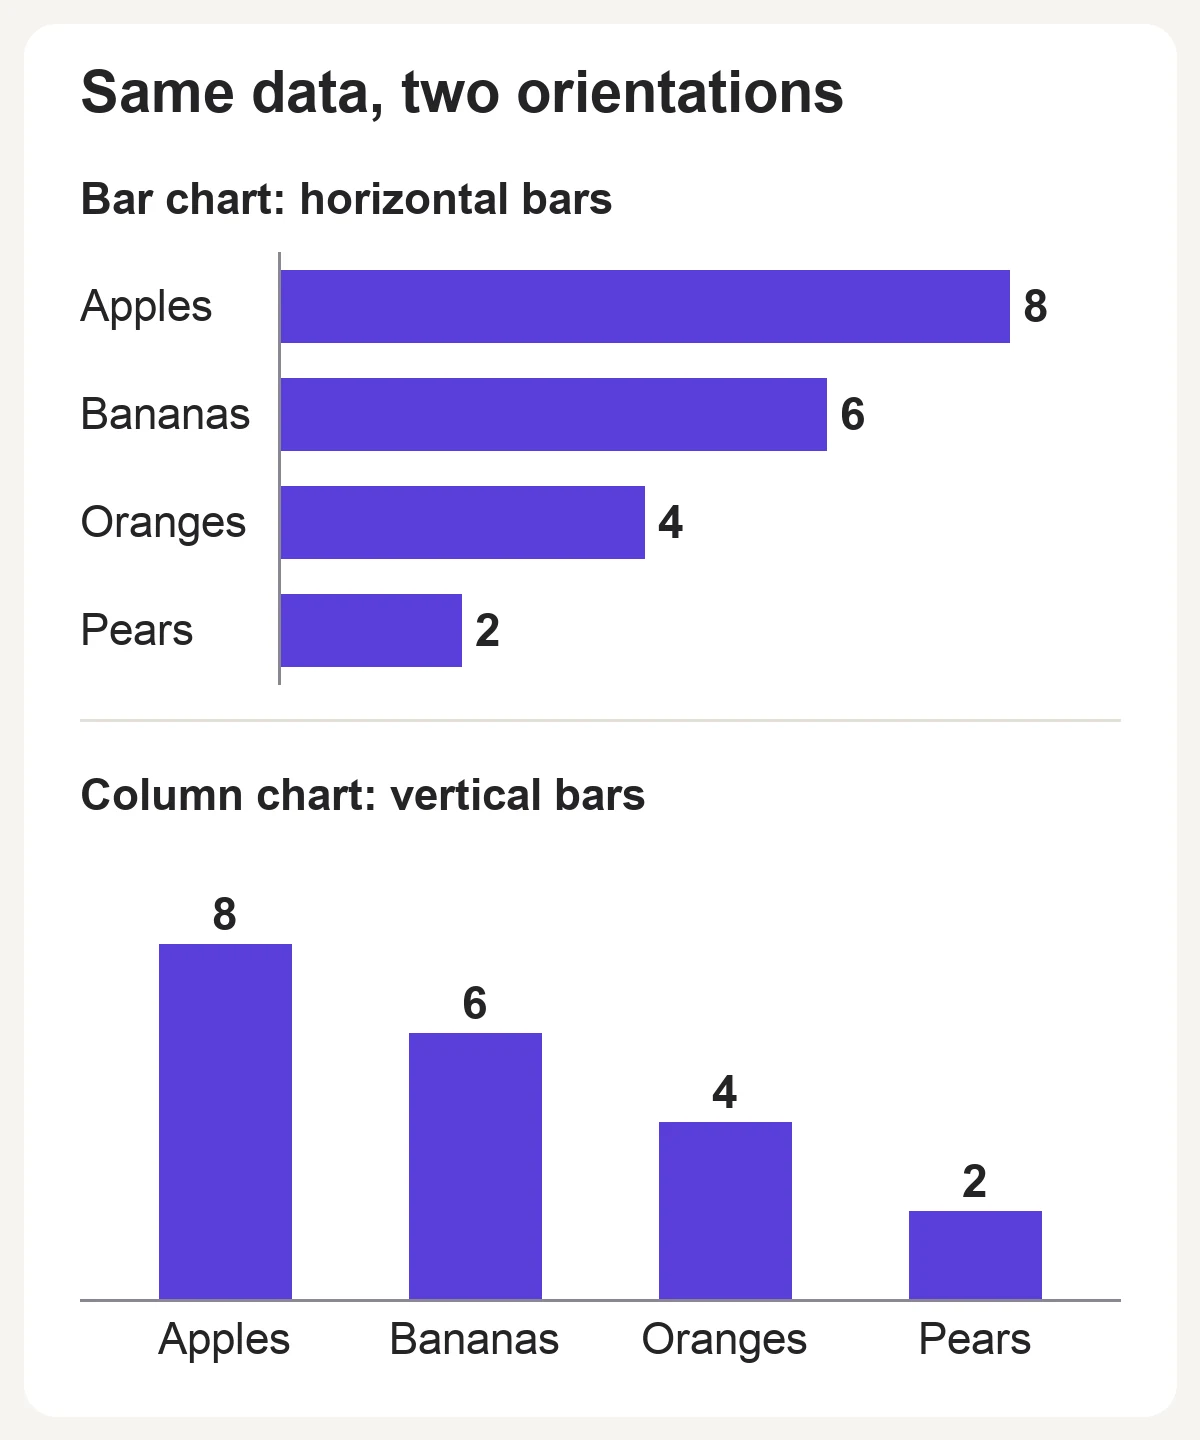
The same four values in two orientations. Pick the one that gives the labels room.
Make the same chart in your tool
| Tool | Menu path or code | Watch for |
|---|---|---|
| Paper | Two axes, a 0–8 scale, one bar per fruit | Equal bar widths and gaps |
| Excel | Insert → Insert Column or Bar Chart → Clustered Bar | Reversed bar order |
| Google Sheets | Insert → Chart, then Chart type → Bar chart | Header row and label column |
| Google Docs | Insert → Chart → Bar | Edit in Open source, then Update |
| Word, PowerPoint | Insert → Chart → Bar → Clustered Bar | Extra sample series; reversed order |
| Python | ax.barh(fruit, students) | Flip the axis with invert_yaxis() |
Menu names can vary by version and platform. Microsoft’s chart guide covers Excel and the worksheet Word and PowerPoint use for charts; Google’s chart guide covers the Sheets chart editor.
On paper
- Draw a vertical line and a horizontal line that meet at the bottom left. Graph paper keeps the spacing even.
- Write the fruit names along one line. Number the other line from 0 to 8 in equal steps, such as one grid square per student.
- Draw one bar per fruit, ending at its count. Make every bar the same width with the same gap between bars.
- Add the title, the axis label Number of students, and the count at the end of each bar.
Excel
Paste the table into cells A1:B5, select A1:B5, and choose Insert → Insert Column or Bar Chart → Clustered Bar. In a bar chart, Excel draws the first row at the bottom, so Pears ends up on top. To match the table, click the vertical (category) axis, choose Format → Format Selection, and tick Categories in reverse order under Axis Options; the value axis moves to the top when you do this, which is expected. If a fruit or count is missing, right-click the chart and choose Select Data to check the range. Then add the chart title and the axis title Number of students. The step-by-step Excel bar graph guide covers formatting, more series, and troubleshooting.
Google Sheets
Paste the table into A1:B5, select it, and choose Insert → Chart. In the chart editor’s Setup tab, set Chart type to Bar chart and make sure row 1 is used as headers and column A as labels. Use the Customize tab to edit the chart and axis titles. The Google Sheets bar graph guide covers more styling and sharing options.
Google Docs
Choose Insert → Chart → Bar. Docs adds a sample chart linked to a new Google Sheets file. Select the chart, choose Link options → Open source, and replace the sample data with the fruit table, deleting any sample rows or columns you do not need. Return to the document and click Update on the chart.
Word and PowerPoint
Choose Insert → Chart, select Bar, and double-click Clustered Bar. A small worksheet with sample data opens. Type the four fruits over the sample categories and the counts over Series 1, then delete the Series 2 and Series 3 columns so the chart has one series. Close the worksheet and check the title and labels on the page or slide. Word and PowerPoint also draw the first row at the bottom, so use the same Categories in reverse order setting as in Excel.
Python
With Matplotlib 3.4 or later installed (pip install matplotlib), this script draws the same chart:
import matplotlib.pyplot as plt

fruit = ["Apples", "Bananas", "Oranges", "Pears"]
students = [8, 6, 4, 2]

fig, ax = plt.subplots()
bars = ax.barh(fruit, students)
ax.invert_yaxis()  # barh() draws the first item at the bottom; flip to match the table.
ax.bar_label(bars, padding=3)  # Print each count at the end of its bar.
ax.set(xlim=(0, 9), xlabel="Number of students", title="Favorite fruit among 20 students")
fig.tight_layout()
plt.show()
barh() draws horizontal bars, and bar_label() adds the counts. See Matplotlib’s barh() reference for more options. To save an image instead of opening a window, replace plt.show() with fig.savefig("fruit-preferences.png", dpi=150).
Check the graph before sharing
- Numbers: Each bar matches the table, and the counts still add up to 20.
- Scale: The value axis starts at zero, so each bar’s length is proportional to its count. A cut-off axis makes small differences look large.
- Labels: Readers can identify each fruit, the unit, and the exact values without relying on color.
- Order: The chart keeps the table’s order, or is sorted by value on purpose. Watch for tools that reverse it.
- Accessibility: Text is large enough to read at the size people will see it, and the alt text states the main comparison and values.
For spacing, color, sorting, and labeling advice, see bar graph design best practices.
Frequently asked questions
Which axis do the categories go on?
In a column chart, categories run along the horizontal x axis and values go up the vertical y axis. In a horizontal bar chart, the axes swap: categories go on the vertical axis and values on the horizontal axis. In this example, the fruits are the categories and the number of students is the value.
What is the difference between a bar graph and a histogram?
A bar graph compares separate categories, such as fruits, so you can reorder the bars. A histogram groups numbers into consecutive intervals, such as ages 10–14 and 15–19, so the bars keep their numeric order and usually touch.
Can I make a bar graph from percentages?
Yes. Label the value axis Percent of students and make sure every percentage uses the same total. Here, each student chose one fruit, so the counts become 40%, 30%, 20%, and 10% of 20 students. If people could pick more than one answer, the percentages can add up to more than 100%, so say so in a note. Do not mix counts and percentages in one series. If the percentages describe one whole with only a few parts, a pie or donut chart is another option; our donut chart vs pie chart guide explains when bars read better.
When should I use a stacked bar graph?
Use one when each category splits into parts that add up to a meaningful total, such as each fruit’s votes split by class. To compare one part across categories precisely, grouped bars usually read more clearly. See when a stacked bar chart works, and when it does not for decision rules and examples. The stacked versus grouped bar graph guide compares both with examples.