Bar Graph Maker: 7 Free Tools Compared, With an Example
A bar graph maker is a tool that turns a list of categories and values into bars you can compare at a glance. For most people the best free option is the spreadsheet that already holds the data: Google Sheets or Excel. Use Canva or Adobe Express when the chart has to match a slide or social post, RapidTables when you want a quick graph with no account, and Datawrapper when you publish the chart on a web page. This guide compares those tools, shows which bar graph type to pick, and walks through one example from raw numbers to a finished chart.
We checked every tool in this guide on its own website or help center on November 1, 2026. The example data is fictional. Free plans change, so confirm limits before you rely on a tool for client work.
When a bar graph is the right chart
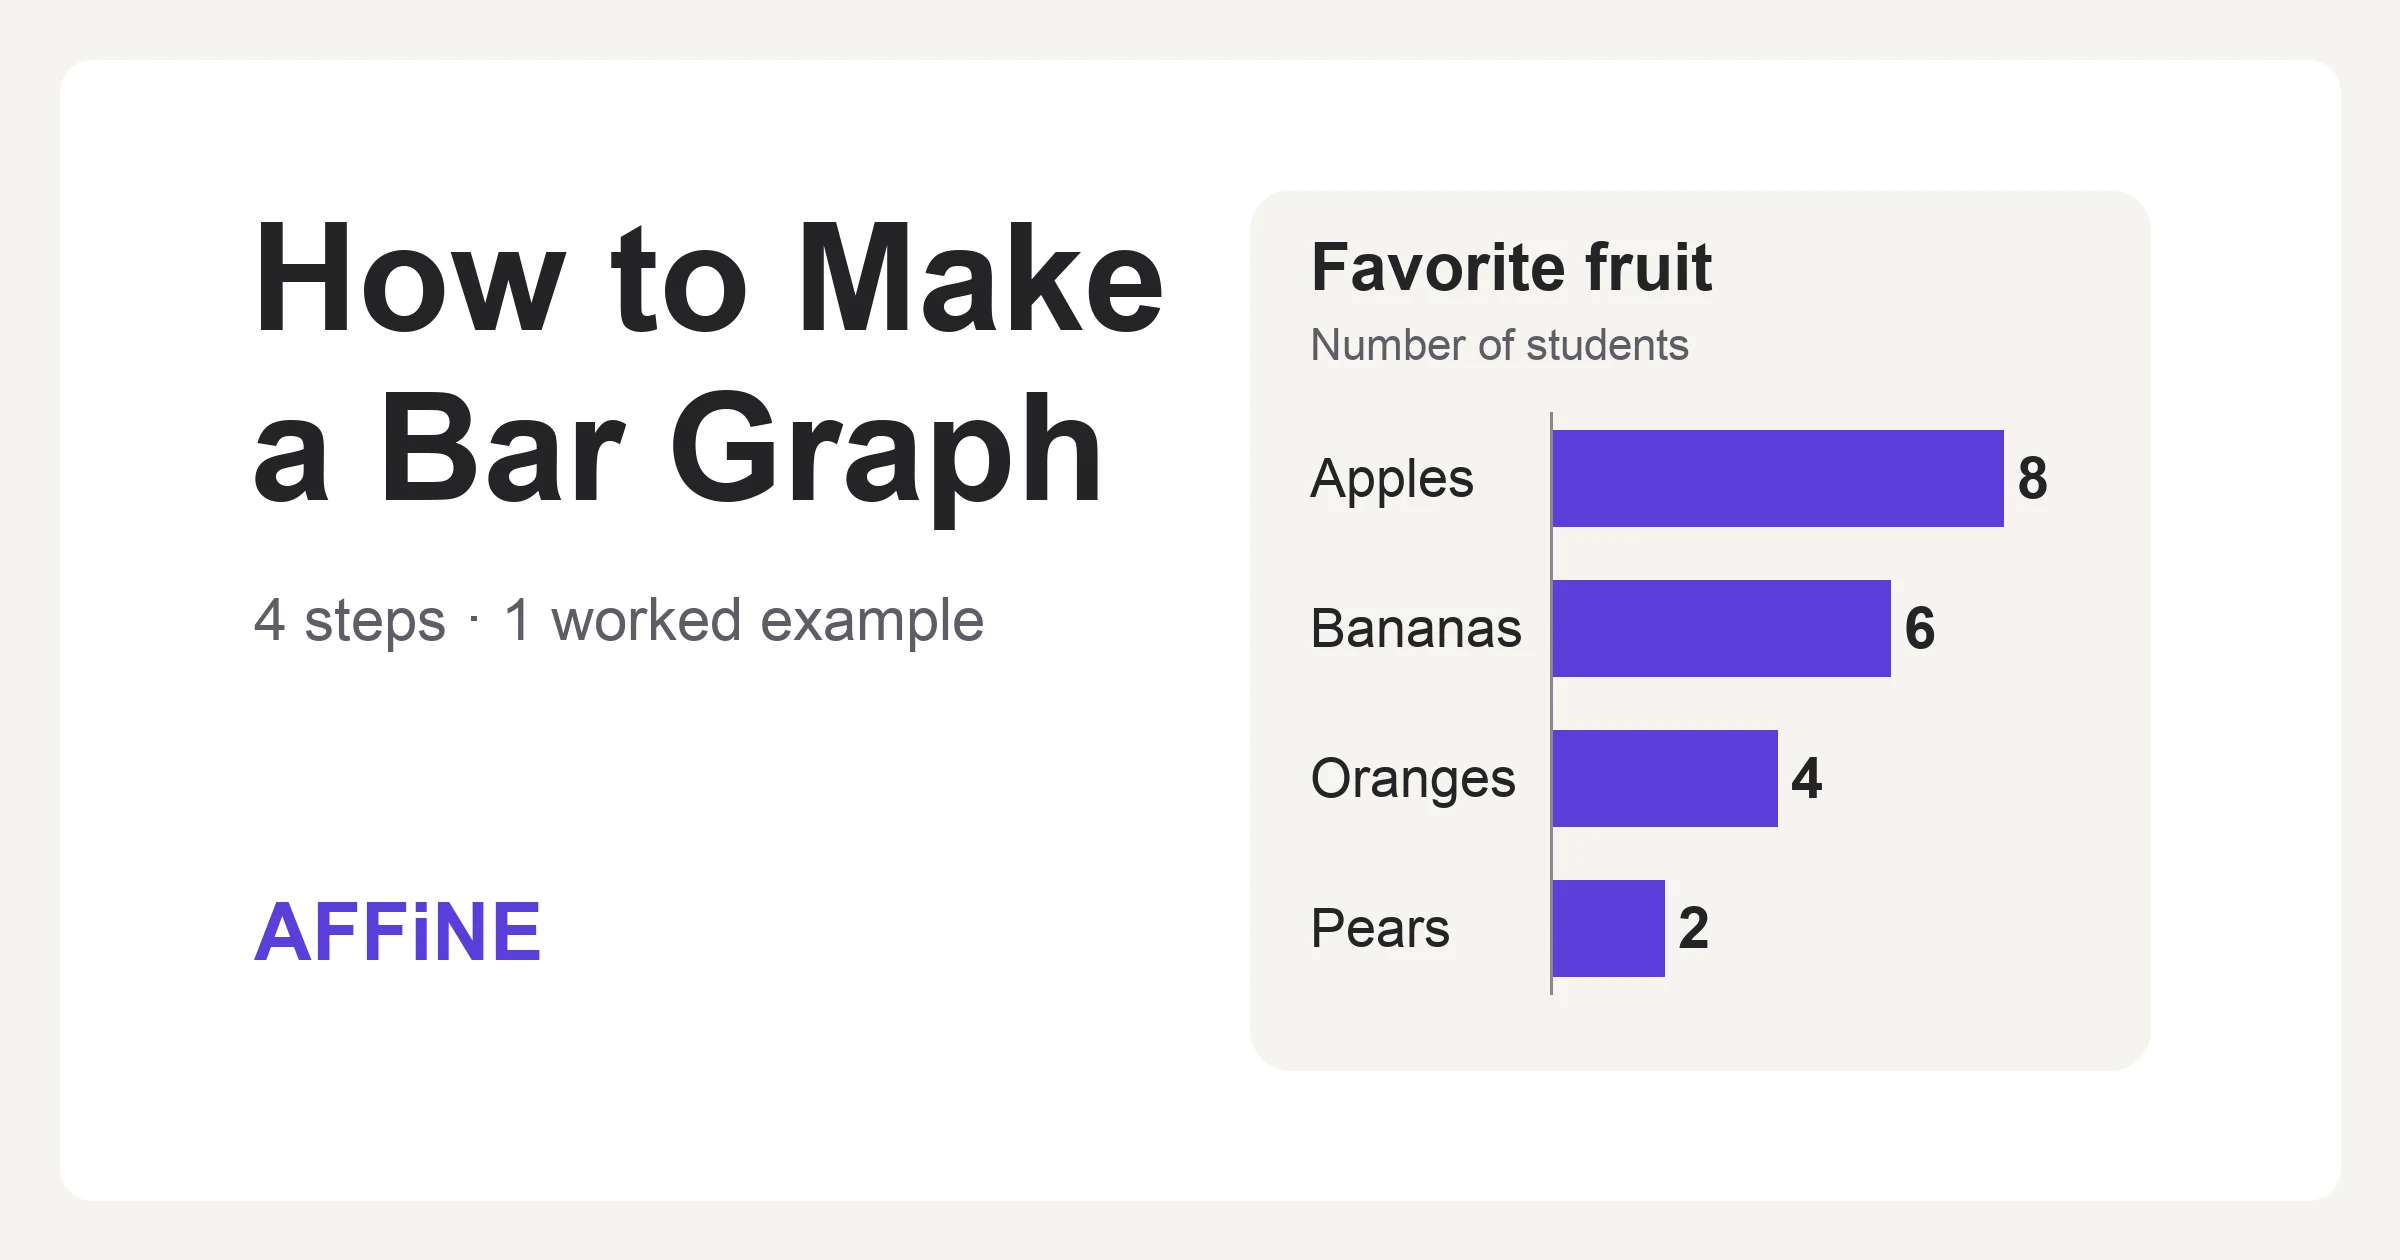
A bar graph compares separate categories: sales by region, tickets by channel, votes by option. Each bar's length shows a value, so readers can rank items and spot the biggest and smallest quickly.
| Your data looks like | Use | Why |
|---|---|---|
| Categories with one value each | Bar graph | Lengths are easy to compare |
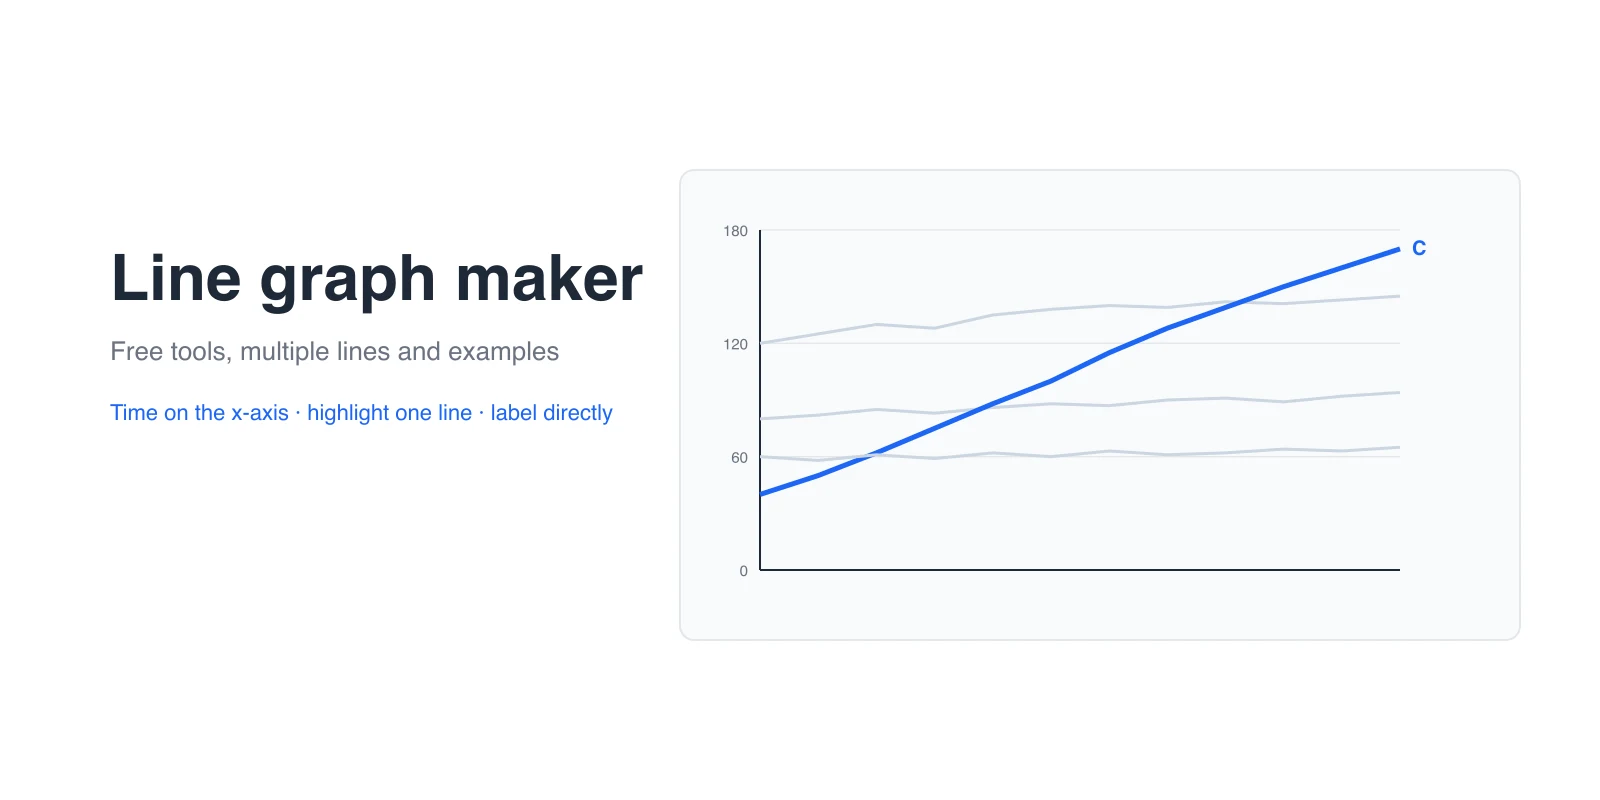
| Values over many evenly spaced dates | Line graph | A line shows the trend better than 30 bars |
| Parts that add up to 100%, five or fewer | Pie chart or bar graph | A bar graph is still easier to read precisely |
| Two numbers per item, such as price and units sold | Scatter plot | Shows the relationship between two variables |
| Counts of a measurement in ranges, such as ages 20–29 | Histogram | The bars touch because the ranges are continuous |
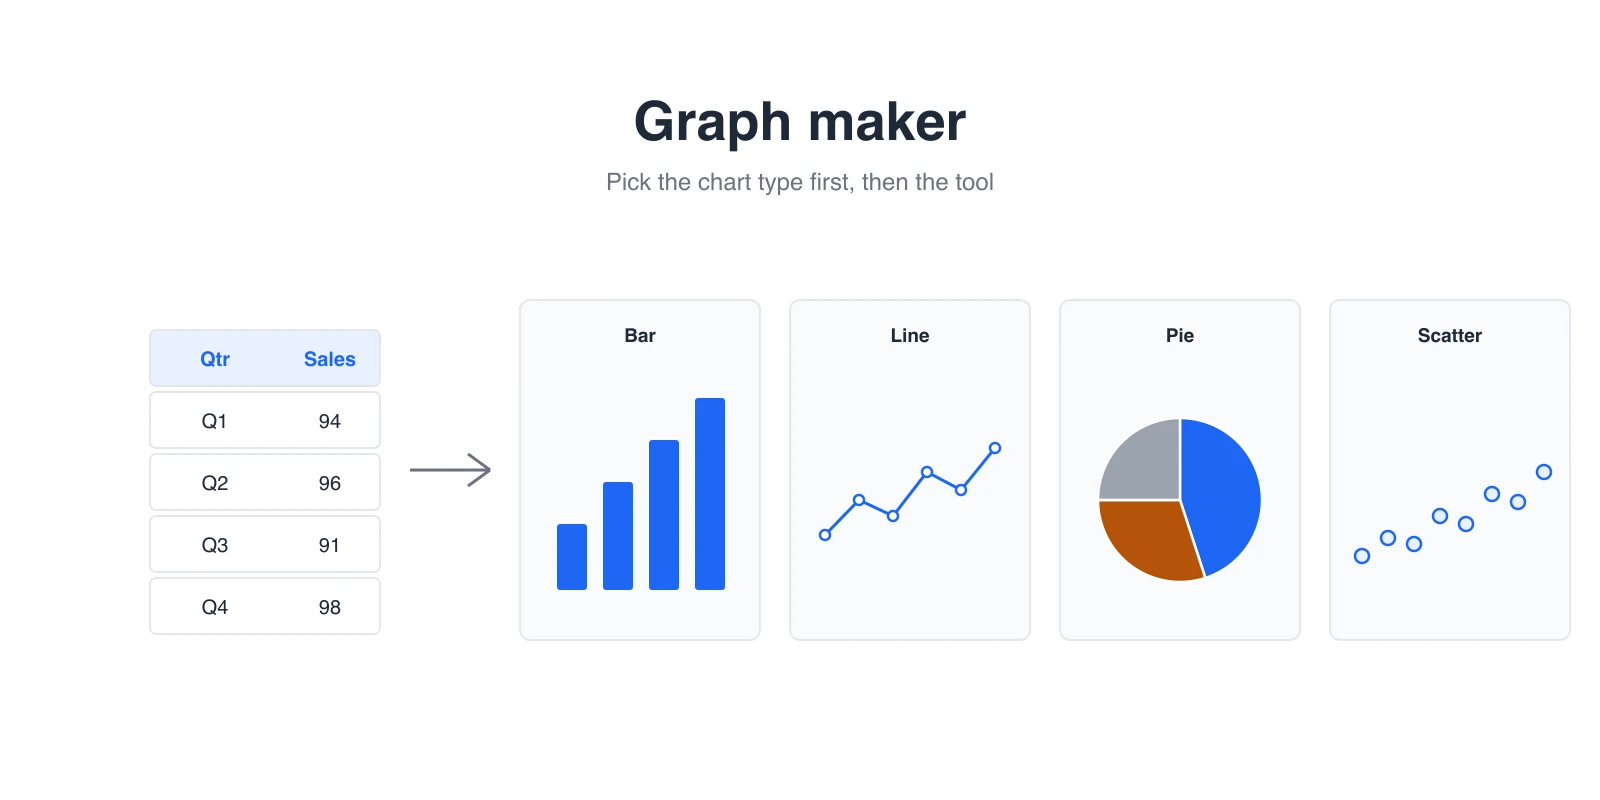
Not sure yet? Our graph maker guide to choosing the right chart type covers all four core chart types side by side.
Free bar graph makers compared
Checked on November 1, 2026.
| Tool | Account needed | How data gets in | Bar types | Getting the chart out | Best for |
|---|---|---|---|---|---|
| Google Sheets | Google account | Type, paste or import a sheet | Bar, column, stacked, 100% stacked | Download as PNG, PDF or SVG; embed in Docs and Slides | Team data that changes |
| Microsoft Excel | Free for Excel for the web; desktop needs Microsoft 365 | Type, paste, import CSV | Clustered, stacked, 100% stacked, bar and column | Copy into Office files; Save as Picture on desktop | Analysts already in Excel |
| Canva | Free account | Type, upload a CSV, or connect Google Sheets | Static bar charts and an animated bar chart race | High-resolution download, share link, present | Slides and social posts |
| Adobe Express | Free account, no credit card | Type into a chart template | Bar charts in branded templates | Download into documents and presentations | Quick branded graphics |
| RapidTables | None | Type values separated by spaces | Grouped (up to 7 bars per group), horizontal, stacked | Print or save from the browser | A fast chart with no sign-up |
| NCES Kids' Zone | None | Form fields, step by step | Simple bar graphs | Print or download from the page | Students and classrooms |
| Datawrapper | Free account | Paste a table or upload a file | Bar, stacked, grouped, split bars | Responsive embed; free plan exports PNG with attribution | Charts on websites and in newsletters |
How to choose quickly:
- The numbers already sit in a spreadsheet: build the chart there. You avoid copy errors, and the chart updates when the data does.
- The chart goes on a slide or in a social post: Canva or Adobe Express.
- You need one chart in two minutes and do not want an account: RapidTables.
- The chart will live on a web page: Datawrapper, because its embeds resize on phones.
For design-first tools reviewed in more depth, see our graph maker tools comparison.
Which bar graph type should you use?
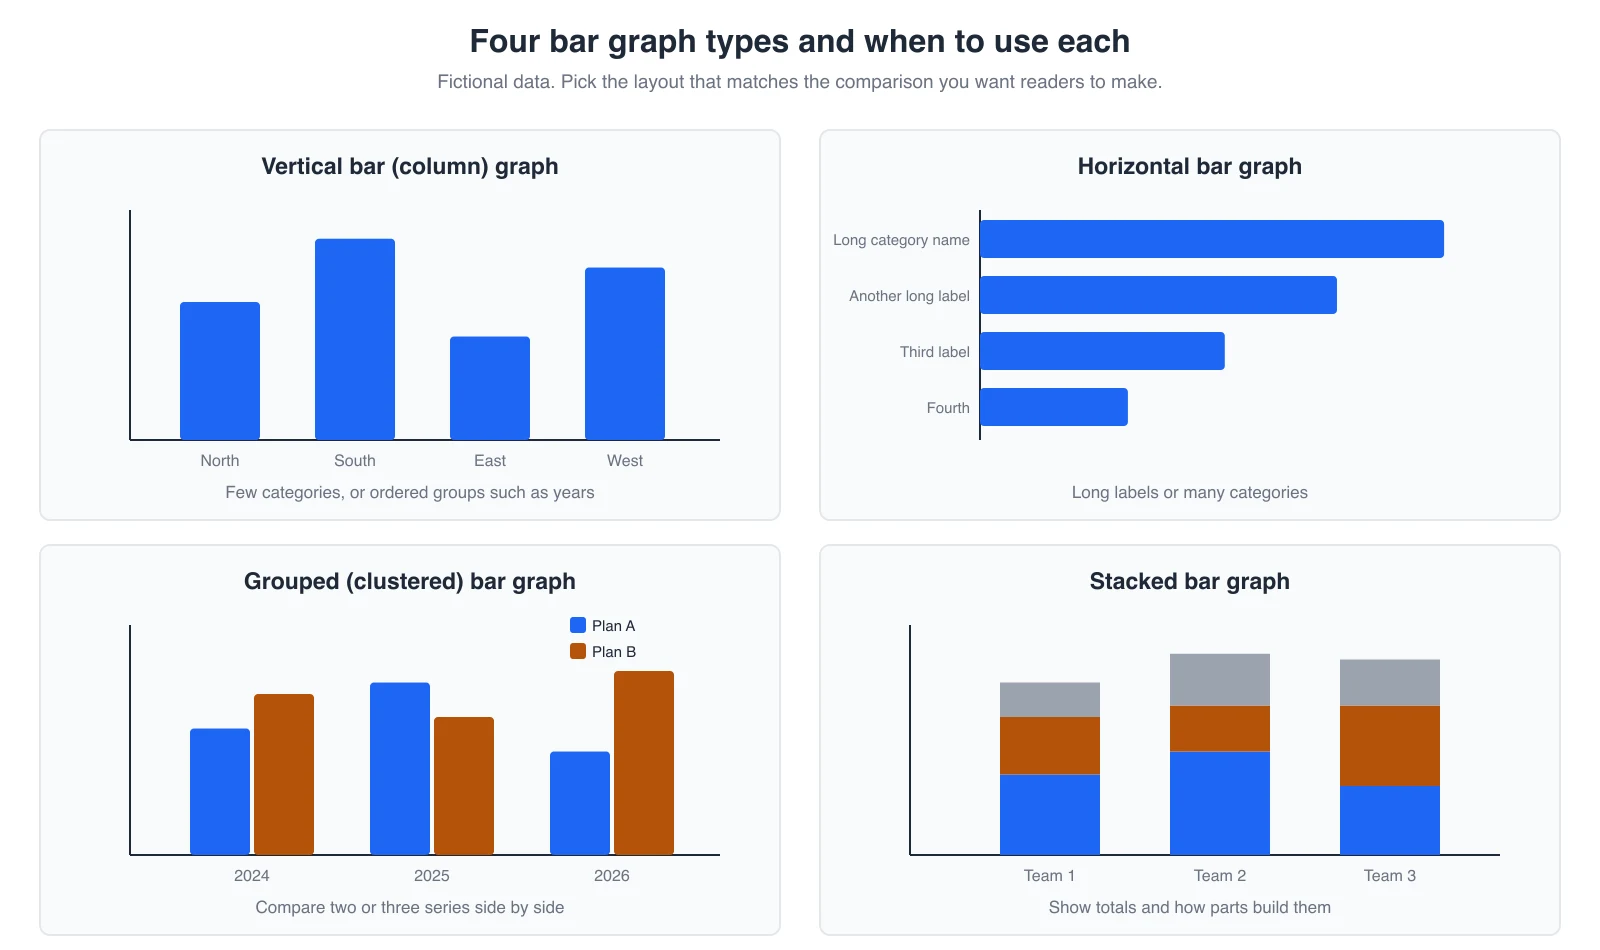
- Vertical bars (column chart): a few categories, or groups with a natural order such as years.
- Horizontal bars: long category names or more than about eight categories. Labels stay readable without rotating them.
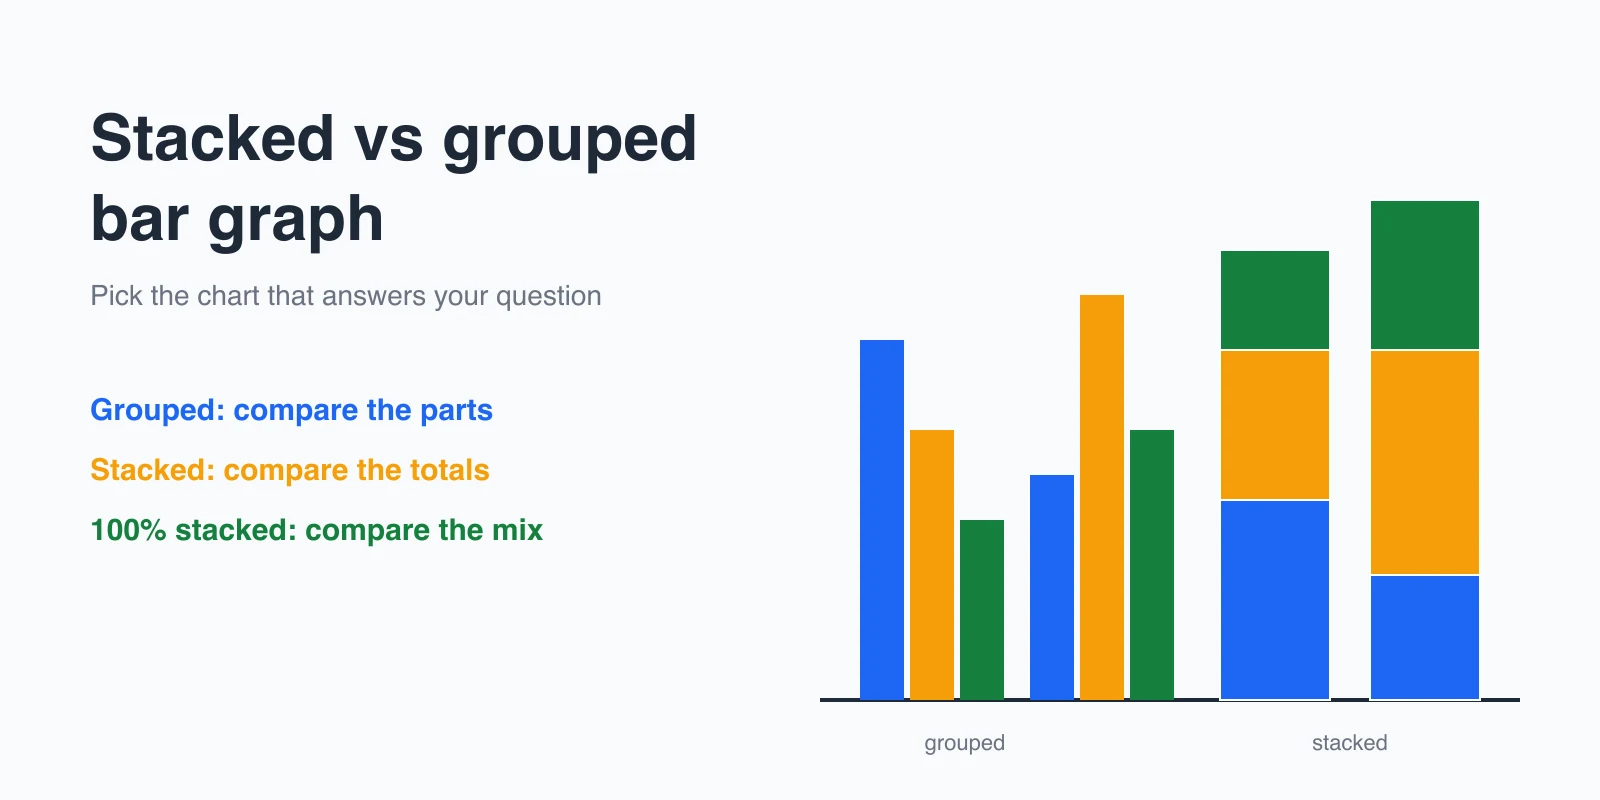
- Grouped (clustered) bars, also called a double bar graph when there are two series: compare two or three series within each category, such as this year and last year.
- Stacked bars, also called segmented bar graphs: show a total and what it is made of. Only the bottom segment is easy to compare across bars, so keep it to three or four segments. See when to use a stacked bar chart and stacked vs grouped bar graphs.
- 100% stacked bars: compare shares rather than totals, such as survey answers by age group.
Worked example: support tickets by channel
Here is a fictional month of support tickets, 1,052 in total:
| Channel | Tickets |
|---|---|
| Phone | 156 |
| 412 | |
| Community forum | 34 |
| Live chat | 389 |
| Social media | 61 |
1. Decide what the chart should say. The team wants to know where the work comes from. That is a ranking question, so a bar graph fits.
2. Paste the table into your bar graph maker. Keep one header row, one row per channel, and numbers without units in the cells.
3. Look at the default chart, then fix it. Most tools produce something like the left chart below: bars in table order, a different color per bar, and a legend.
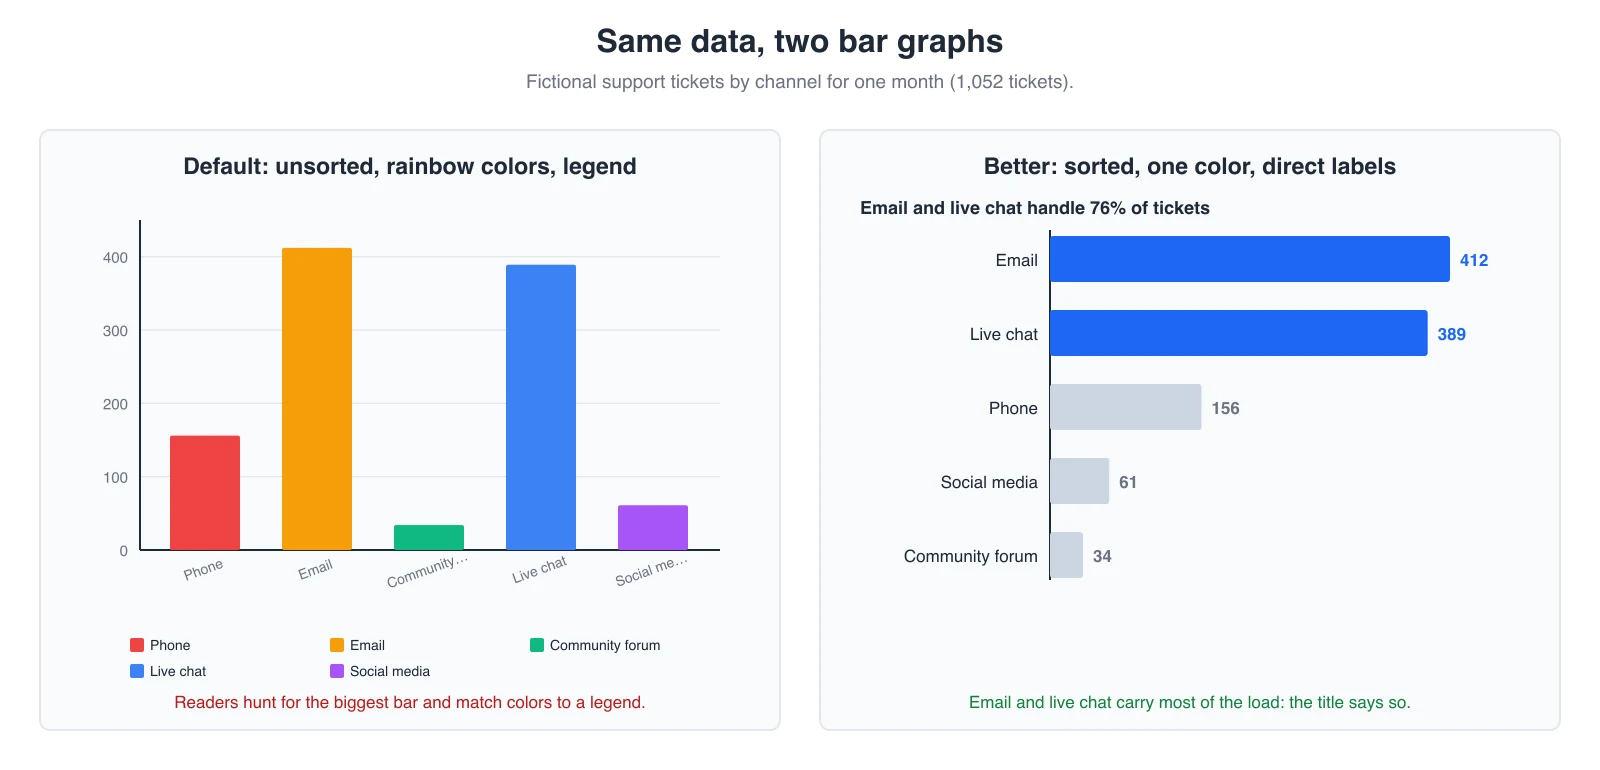
The right chart makes four changes:
- Horizontal and sorted from largest to smallest, so "Community forum" fits and the ranking is instant.
- One color, with the two channels that matter highlighted. Color now carries meaning instead of decoration.
- Values on the bars, so the gridlines and legend can go.
- A title that states the finding: email and live chat together handle 801 of 1,052 tickets, or 76%.
4. Check the axis and export. The value axis starts at 0, so bar length stays honest. Export a PNG for slides or an SVG when the chart will be printed or resized.
Make the same chart in Google Sheets or Excel
Google Sheets: select the table, choose Insert > Chart, then pick Bar chart on the Setup tab. To sort the bars, sort the table itself (Data > Sort range, Z to A on the Tickets column). Add data labels under Customize > Series.
Excel: select the table, choose Insert > Charts > Bar, then sort the source data from largest to smallest. Excel draws horizontal bars from the bottom up, so sort ascending if you want the largest bar on top, or set Categories in reverse order on the vertical axis.
Full tutorials, including stacked charts, Word and Google Docs:
- How to make a bar graph in Excel
- How to make a bar graph in Google Sheets
- How to make a bar graph in any tool, including Word and Google Docs
- Creating a bar graph from survey data
Export, share or embed your bar graph
- PNG for slides, chat and documents. Download at a large size so it stays sharp.
- SVG for print and for designers. It is a vector file, so it scales without blurring. Google Sheets downloads charts as SVG; on Datawrapper, SVG export is a paid feature.
- PDF for reports that will be printed as-is.
- Embed when the data will change. In Google Sheets, open the chart's three-dot menu and choose Publish chart, or paste it into Docs or Slides as a linked chart. Datawrapper gives you an embed code that resizes on phones.
- On a phone: the Google Sheets app and the Canva app both edit charts, but building one from a large table is easier on a computer.
When you put a bar graph on a web page, write alt text that states the takeaway ("Email and live chat handle 76% of support tickets"), not just "bar graph".
Bar graph checklist before you share
| Check | Why it matters |
|---|---|
| Value axis starts at 0 | A truncated axis makes small differences look large |
| Bars sorted, unless categories have a natural order | Readers see the ranking without effort |
| One color, plus a highlight for the point you are making | Rainbow colors suggest differences that do not exist |
| Labels readable without tilting your head | Switch to horizontal bars instead of rotating text |
| Units in the title or axis, such as "tickets per month" | Avoids confusing counts, percentages and currency |
| No 3D or shadows | Perspective distorts bar length |
| Title states the takeaway | Readers know what to look for |
| Alt text describes the finding | Screen reader users get the same message |
The longer version, with copy-paste checklists for each tool, is in our bar graph design best practices.
Frequently asked questions
What is the best free bar graph maker?
If your data is in a spreadsheet, Google Sheets or Excel is the best free bar graph maker because the chart stays linked to the numbers. For designed graphics, use Canva or Adobe Express. For a quick chart without an account, use RapidTables. For charts embedded on websites, use Datawrapper.
Can I make a bar graph online without signing up?
Yes. RapidTables and the NCES Kids' Zone graph tool both work in the browser without an account. Type your labels and values, draw the chart, then print or save it.
What is the difference between a bar graph and a histogram?
A bar graph compares separate categories, and the bars have gaps between them. A histogram shows how a numeric measurement is distributed across ranges, such as ages 20–29 and 30–39, so its bars touch.
Should I use a vertical or horizontal bar graph?
Use vertical bars for a few categories or for ordered groups such as years. Use horizontal bars when category names are long or when you have more than about eight categories.
How many bars are too many?
There is no fixed limit, but past about 15 bars readers stop comparing and start scanning. Show the top 10 and group the rest as "Other", or split the chart into smaller charts.
Is a bar chart the same as a bar graph?
Yes. "Bar chart" and "bar graph" mean the same thing. Some tools, including Excel and Google Sheets, call vertical bars a "column chart" and horizontal bars a "bar chart".
How do I make a double bar graph?
Put categories in the first column and each series in its own column, for example "2025" and "2026". Select the table and insert a bar or column chart: each category gets two bars side by side. In Excel this is a clustered bar chart.
Is my data private in an online bar graph maker?
It depends on the tool. Google Sheets, Canva and Datawrapper store your data in your account on their servers. For confidential numbers, use desktop Excel, or a tool that processes data in your browser, such as RAWGraphs, and read the privacy policy before you upload anything.
Can I make an animated bar chart race for free?
Canva includes an interactive bar chart race in its charts library, and you can edit it with your own data on a free account. Check the export options on your plan before you plan a video around it.
Keep the data and the chart together
A bar graph is only as good as the table behind it. In AFFiNE you can keep the source table, your notes and the exported chart in one doc, or lay out a dashboard on the AFFiNE whiteboard. If your data is still scattered, start with a free online table maker.
Update note (November 1, 2026): This article was first published in June 2025 and rewritten in November 2026. We replaced a long, generic overview with a dated comparison of seven free bar graph makers checked on each vendor's site, a guide to bar graph types, a worked example with original before-and-after charts, export and embed guidance, and a sharing checklist. We moved the full Excel, Google Sheets, Word and Google Docs tutorials to their own linked guides and replaced the shared cover and unlabeled images with original graphics. AI tools assisted with drafting, and the content was reviewed and edited by the AFFiNE team.