Graph Maker: How to Choose the Right Chart and Free Tool
A graph maker is a tool that turns a table of numbers into a chart, such as a bar graph, line graph, pie chart or scatter plot. You probably already have one: Google Sheets and Excel for the web both make charts for free. The harder part is choosing the chart that answers your question, and then picking a tool that exports and shares it the way you need. This guide gives you a chart-type decision table, a comparison of free graph makers checked on October 31, 2026, a worked example, and the mistakes that make graphs misleading.
The example data in this guide is fictional. Tool features and prices come from each vendor's own pricing or help pages, checked on October 31, 2026. They change often, so confirm before you commit a team to a plan.
What does a graph maker do?
Every graph maker, from a spreadsheet to a design app, follows the same four steps:
- Take in data. You paste a table, upload a CSV or spreadsheet, or connect a live source.
- Map data to a chart type. Categories go on one axis, values on the other, or two numeric columns become x and y.
- Let you label and style the chart. Titles, axis labels, units, colors and data labels.
- Export or share it. A PNG for slides, an SVG or PDF for print, or an embed link for a web page.
When you compare tools, the differences are in steps 1 and 4: how data gets in, and which formats come out. Chart styling matters less than most "best graph maker" lists suggest.
Which graph should you make?
Decide on the chart before you open any tool. Start from the question your audience will ask.
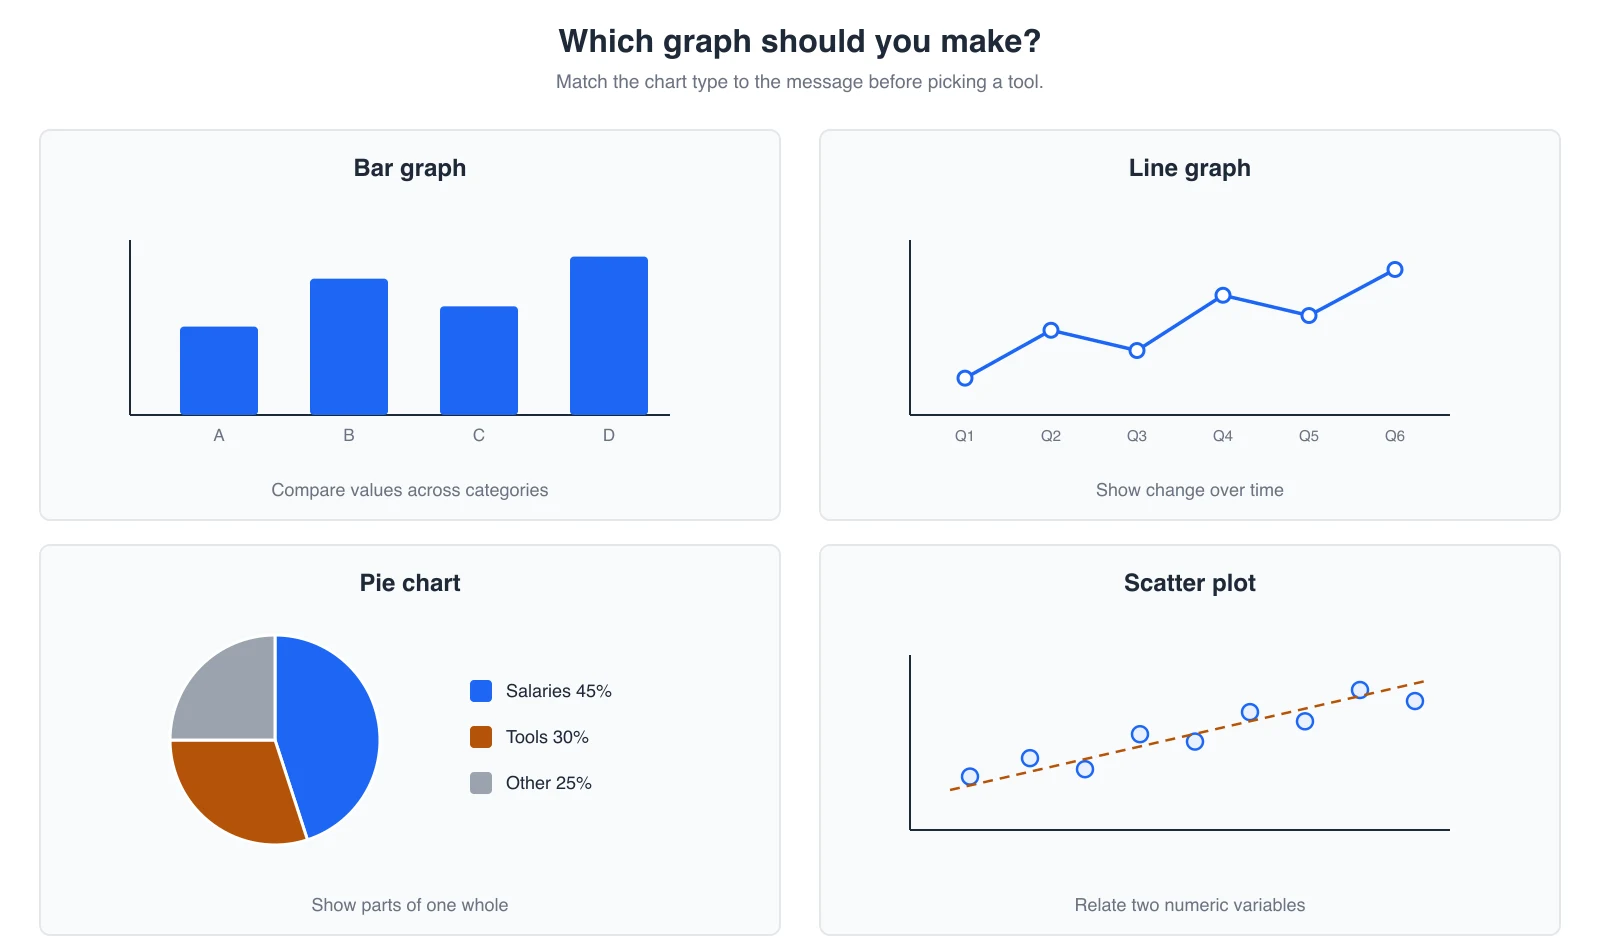
| The question you are answering | Chart type | Works best when | Avoid it when | Step-by-step guide |
|---|---|---|---|---|
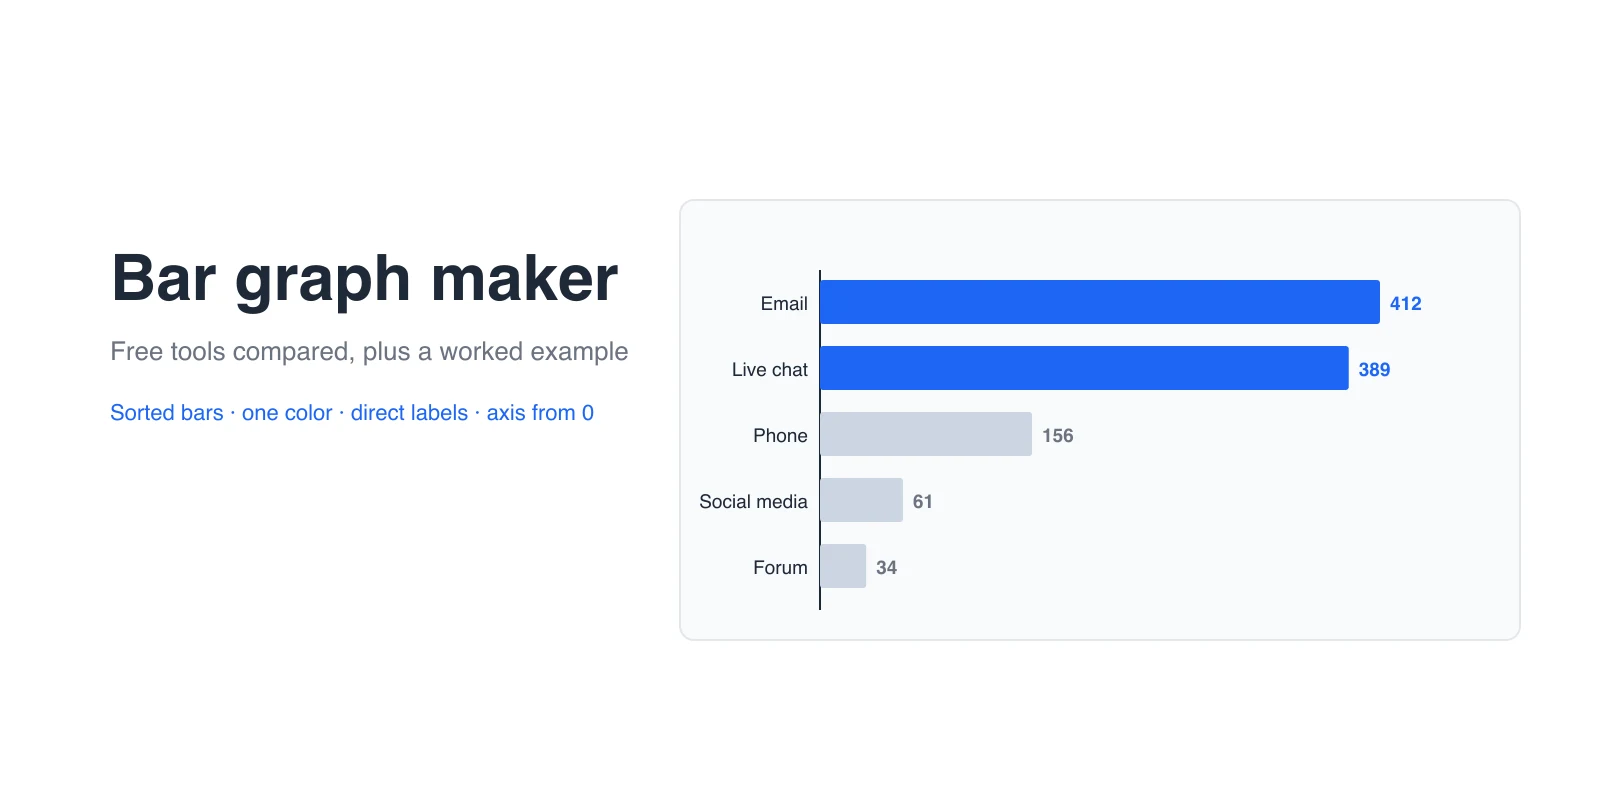
| How do these categories compare? | Bar graph | You compare a handful to a few dozen categories | The x-axis is continuous time with many points | Bar graph maker guide |
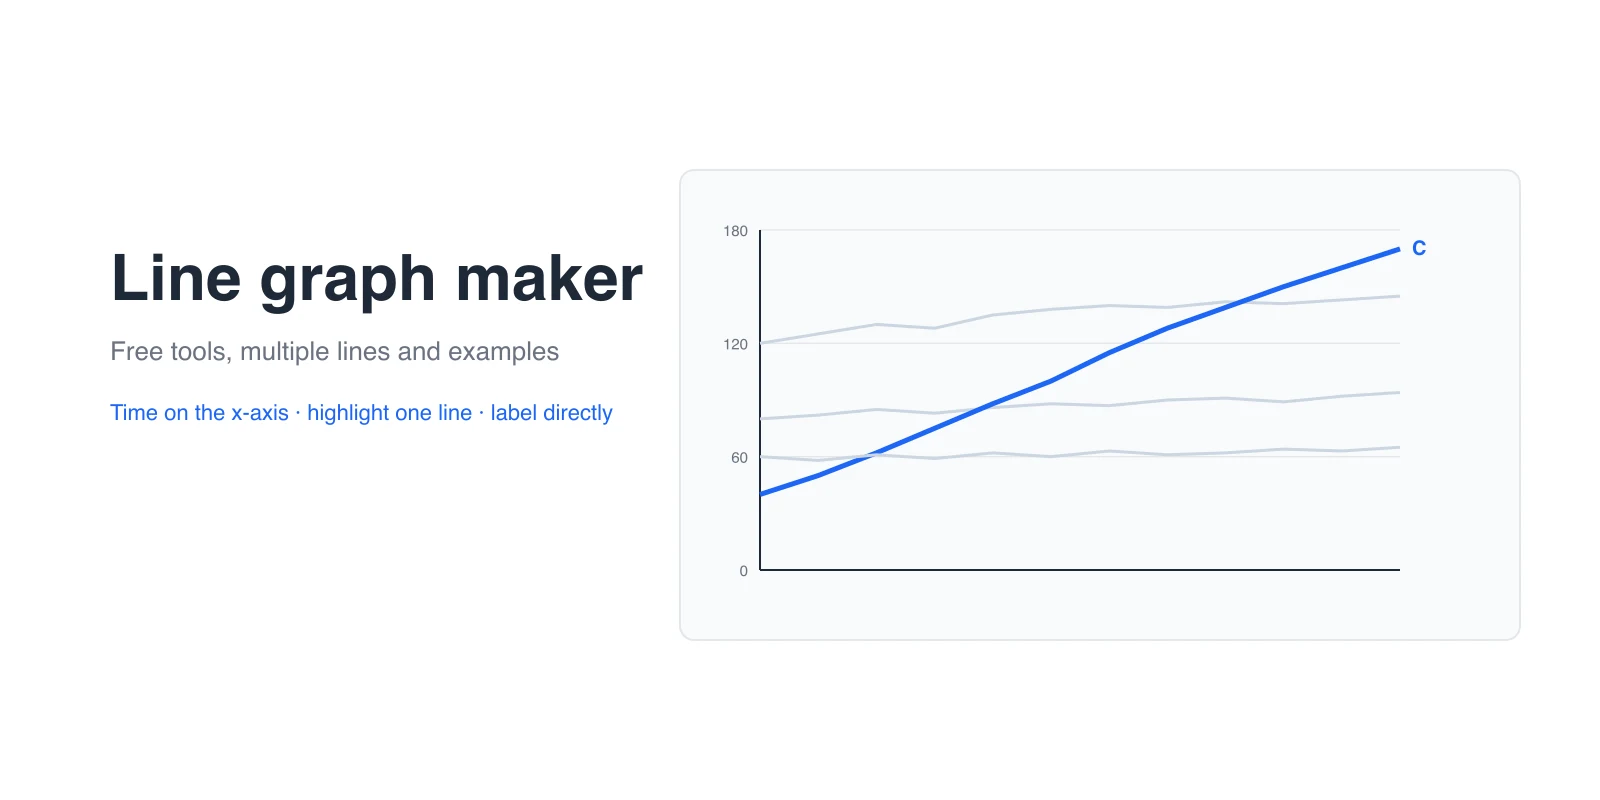
| How did a value change over time? | Line graph | Time is evenly spaced and you want the trend | Categories have no natural order | Line graph maker guide |
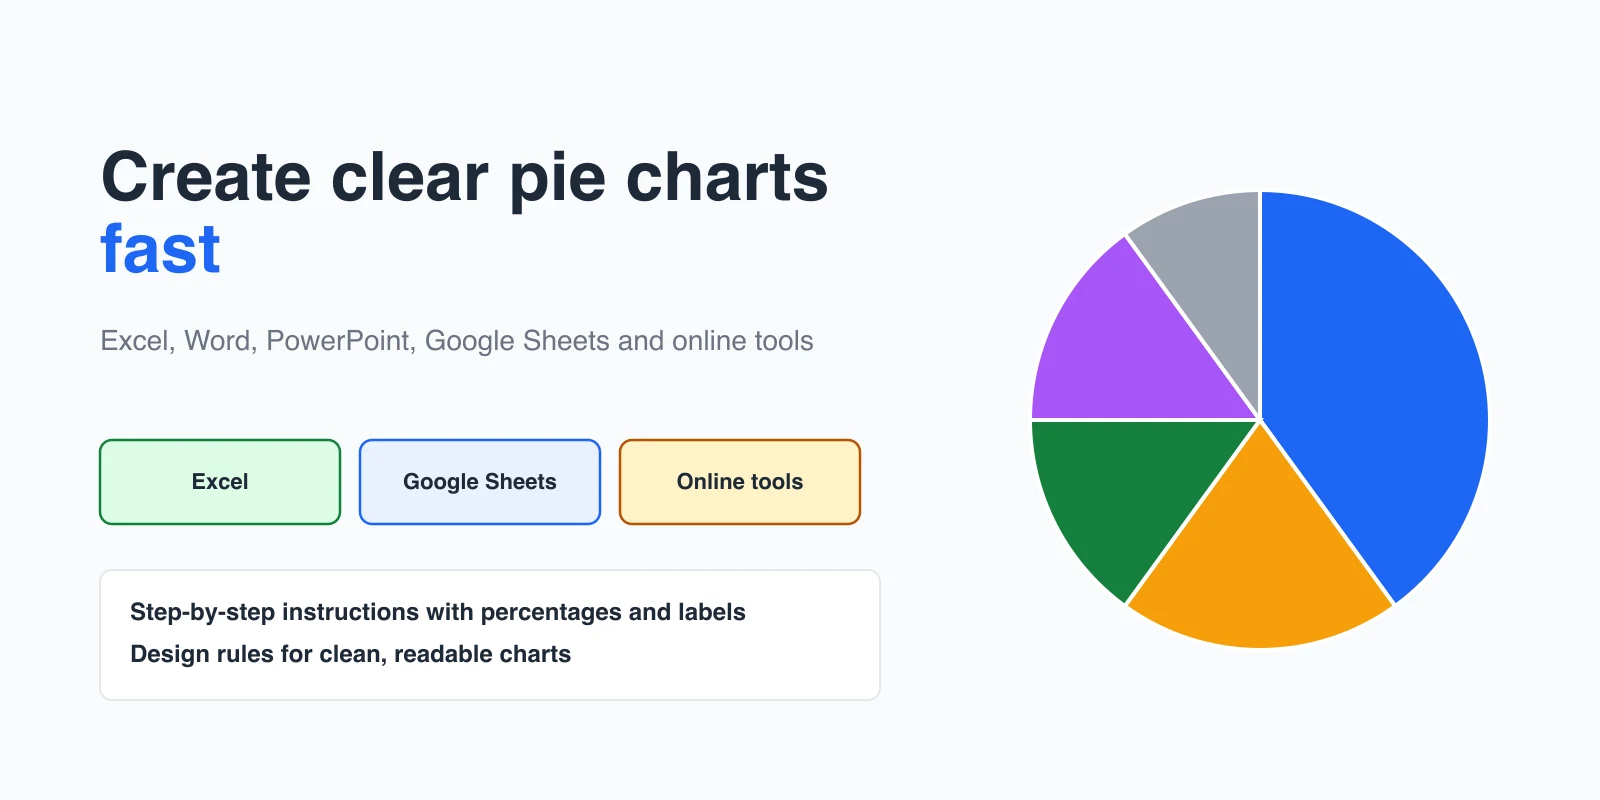
| What share of the whole is each part? | Pie or donut chart | There are about five slices or fewer and they add to 100% | You need to compare similar-sized parts precisely | Pie chart maker guide |
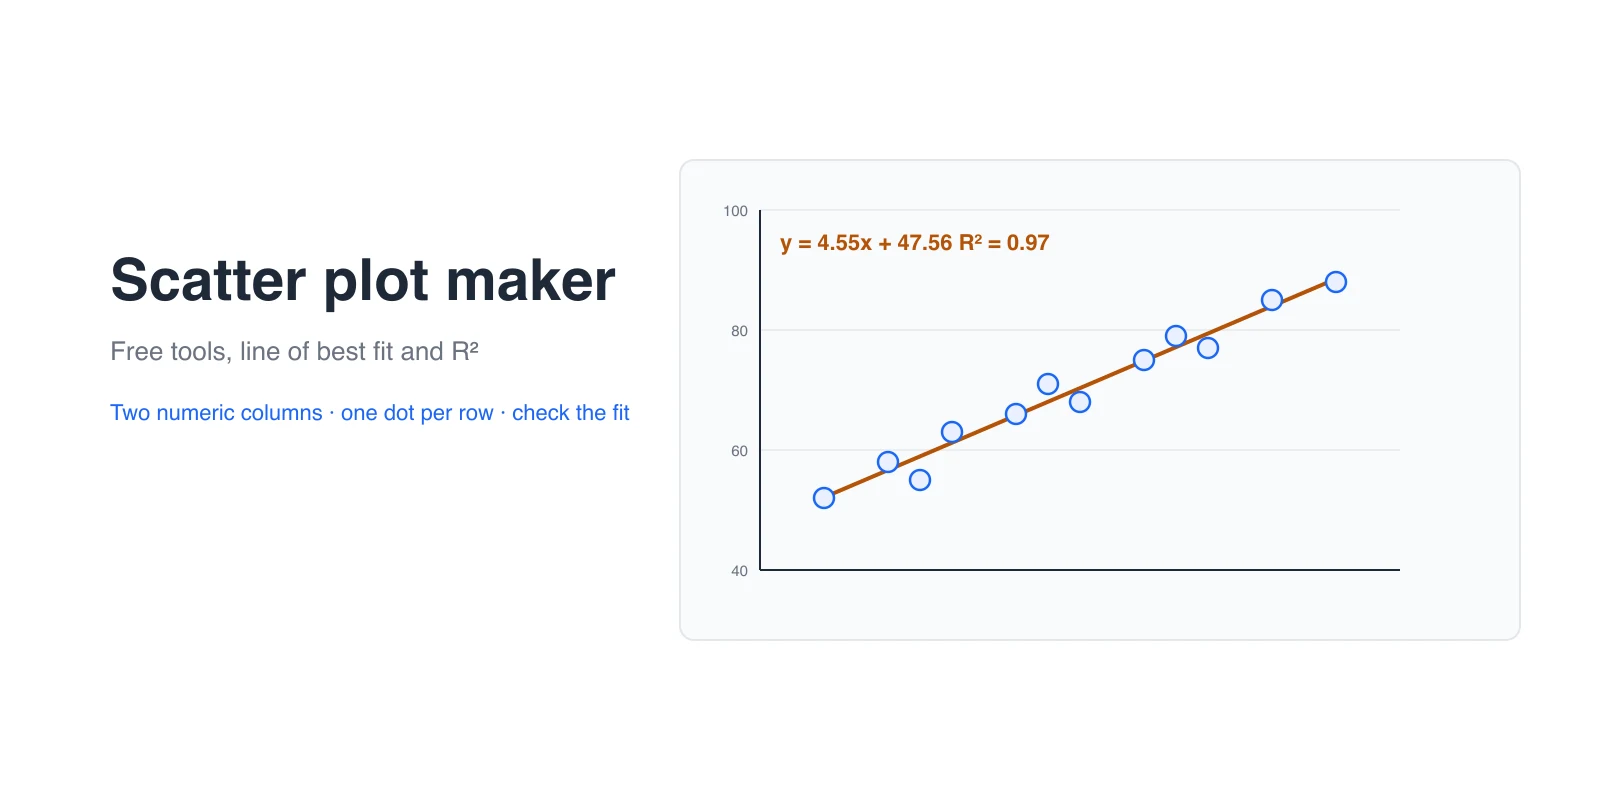
| Are two numeric variables related? | Scatter plot | Each row has two measurements, such as price and units sold | One variable is a category | Scatter plot maker guide |
| How do parts compare across groups? | Stacked or grouped bar | You show composition (stacked) or side-by-side values (grouped) | There are more than four or five segments per bar | Stacked vs grouped bar graphs |
| Where do supply and demand meet? | Supply and demand graph | You explain prices, shortages or surpluses | You only have one data series | How to draw a supply and demand graph |
Three quick rules settle most cases:
- If the x-axis is time, start with a line graph.
- If you have more than five or six parts, use a bar graph instead of a pie chart. The donut chart vs pie chart guide covers the edge cases.
- If readers need to compare exact values, use bars. People judge length more accurately than angles or areas.
Free graph makers compared
Checked on October 31, 2026, on each vendor's pricing or help pages. We grouped tools by type, because a spreadsheet, a publishing tool and a BI tool solve different problems.
| Tool | Type | Free option | Export and sharing | Best for | Watch out for |
|---|---|---|---|---|---|
| Google Sheets | Spreadsheet | Free with a Google account | Download as PNG, PDF or SVG; publish or embed | Team charts from live, shared data | Limited styling and annotation |
| Microsoft Excel | Spreadsheet | Excel for the web is free with a Microsoft account; the desktop app needs Microsoft 365 | Copy into Office files; Save as Picture in the desktop app | Analysts who already work in Excel | Some chart and export features are desktop-only |
| Datawrapper | Online chart tool for publishing | Free plan with unlimited charts and attribution | Free plan exports PNG; Pro ($21 per user per month) adds PDF and SVG | Clean, responsive charts embedded in articles and reports | Free charts carry Datawrapper attribution |
| RAWGraphs | Open-source web app | Free and open source | Vector (SVG) and raster (PNG) export | Less common chart types (about 30), with data processed in your browser | Designed for static charts you finish elsewhere |
| Tableau Public | BI and dashboards | Free | Publishes to a public profile | Interactive dashboards built on public data | Everything you publish is public; do not use it for private data |
| Code: Python with Matplotlib, or Chart.js | Programming libraries | Free and open source | Any format you script | Repeatable charts that update with new data | You need to write and maintain code |
| AI assistants with code execution | Chat interface | Varies by product and plan | Usually PNG, plus the generated code | A fast first draft from an uploaded file | Check every number and label against your source |
Which one should you pick?
- You need a quick chart for a meeting: Google Sheets or Excel, whichever already holds the data.
- You publish charts on a website or in a newsletter: Datawrapper.
- You want an unusual chart, such as a Sankey or beeswarm, without code: RAWGraphs.
- You want a public, interactive dashboard: Tableau Public.
- You redo the same chart every week: a short Python or Chart.js script.
For hands-on reviews of design-first tools such as Canva, Visme and Adobe Express, see our graph maker tool comparison. For dashboards and business charts beyond graphs, see the chart maker guide.
Where AFFiNE fits. AFFiNE is not a dedicated charting engine, and we will not pretend it is. Our team uses it around the chart: we keep the source table in a doc, sketch the chart layout on the AFFiNE whiteboard, and place the exported chart next to the notes that explain it. If you only need the chart, use one of the tools above.
Worked example: graph four quarters of results
Say your team has these fictional customer satisfaction scores, out of 100:
| Quarter | Score |
|---|---|
| Q1 | 94 |
| Q2 | 96 |
| Q3 | 91 |
| Q4 | 98 |
1. Write the question. "Did satisfaction change from quarter to quarter?" The x-axis is time, but there are only four periods and readers will compare each quarter, so a bar (column) graph works. A line graph also works if you want to stress the trend.
2. Build it in Google Sheets. Select both columns, including headers, then choose Insert > Chart. In the chart editor, pick Column chart on the Setup tab. On the Customize tab, add a chart title and axis titles, and set the vertical axis minimum to 0.
3. Check the axis. This is where most graphs go wrong. The bars below show the same four numbers. On the left the value axis starts at 0; on the right it starts at 90.
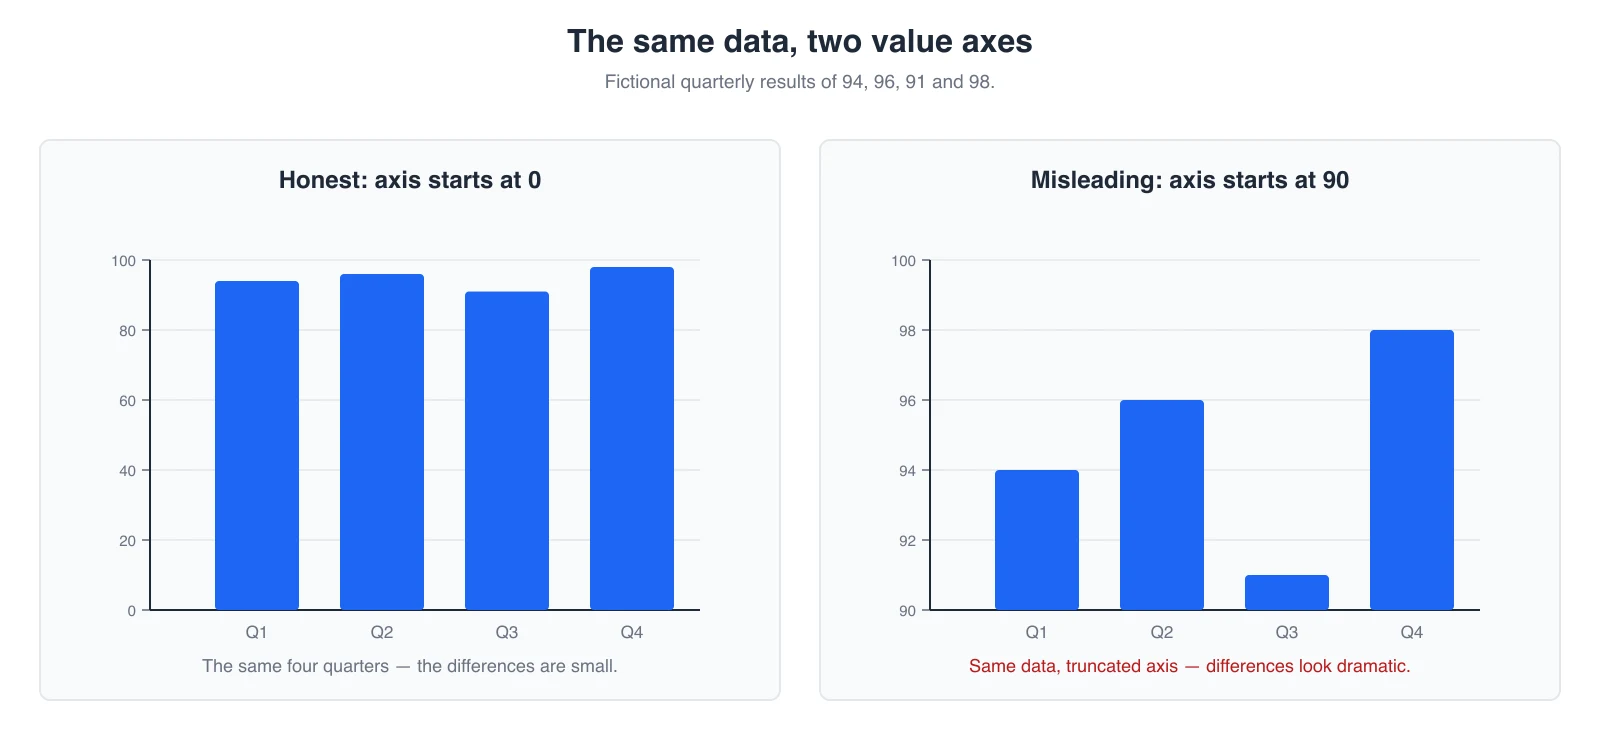
Bar length encodes the value, so a bar graph's value axis should start at 0. If the 5-point drop in Q3 is the real story, switch to a line graph with a labeled axis, or add a data label and a short note, rather than truncating the bars.
4. Make the title the takeaway, then export. "Satisfaction dipped in Q3 and recovered in Q4" tells readers what to see. In Sheets, open the chart's three-dot menu and choose Download to save a PNG for slides or an SVG for print.
How to make a graph in Excel or Google Sheets
Both spreadsheets follow the same pattern. Here is the short version, with links to full tutorials.
In Excel:
- Select your data, including the header row.
- Go to Insert > Recommended Charts, or choose a chart type from the Charts group.
- Use the Chart Elements (+) button to add titles, axis titles and data labels.
- To reuse the chart outside Office, right-click it and choose Save as Picture (desktop app).
Full walkthrough: how to make a bar graph in Excel.
In Google Sheets:
- Select your data, including headers.
- Choose Insert > Chart. Sheets suggests a chart type; change it on the Setup tab.
- Edit titles, colors, axes and labels on the Customize tab.
- Use the chart's three-dot menu to download it as PNG, PDF or SVG, or publish it.
Full walkthrough: how to make a bar graph in Google Sheets. If you have not picked a tool yet, the four-step how to make a bar graph guide works in any graph maker.
Common graph mistakes and how to fix them
| Mistake | Why it misleads | Fix |
|---|---|---|
| Bar graph axis that does not start at 0 | Small differences look large | Start bars at 0, or switch to a line graph |
| Pie chart with many slices | Similar angles are hard to compare | Keep five slices or fewer, or use a sorted bar graph |
| 3D effects and shadows | Perspective distorts bar heights and slice sizes | Use flat 2D charts |
| Two value axes on one chart | Readers match the wrong line to the wrong scale | Use two small charts side by side |
| Missing units or axis titles | Readers cannot tell percent from count | Label axes and put units in the title or axis |
| Color as the only way to tell series apart | Hard to read for color-blind readers and in print | Add direct labels or patterns, and check contrast |
| Uneven time intervals on a line graph | The slope suggests a false trend | Use evenly spaced dates, or mark the gaps |
For a longer checklist, see bar graph design best practices. To turn a correct chart into a clear message, see these data storytelling examples.
Prepare your data before you open a graph maker
Most chart problems start in the table. Before you import anything:
- Use one header row, with one row per item and one column per variable.
- Keep numbers as numbers. Put units in the header, such as "Revenue (USD)", not in each cell.
- Use one date format and one time interval.
- Remove totals and subtotal rows, which graph makers otherwise plot as extra categories.
If your data still lives in notes or documents, a free online table maker helps you structure it first. Survey answers need an extra counting step, covered in creating a bar graph from survey data.
Frequently asked questions
What is the best free graph maker?
For most people, the best free graph maker is the spreadsheet that already holds the data: Google Sheets or Excel for the web. Use Datawrapper when you publish charts online, RAWGraphs for less common chart types, and Tableau Public for interactive dashboards built on public data.
Does Google have a graph maker?
Yes. Google Sheets makes charts from any selected range through Insert > Chart, and you can download them as PNG, PDF or SVG or embed them in Google Docs and Slides.
Can AI make a graph from my data?
Yes. AI assistants that can run code will read an uploaded spreadsheet and draw a chart, usually with Python. Treat the result as a first draft: check that the totals, labels and axis ranges match your source data before you share it.
Which graph is best for showing change over time?
A line graph, with time on the x-axis at even intervals. For a few periods that readers will compare one by one, a column graph also works.
When should you not use a pie chart?
Avoid a pie chart when you have more than about five parts, when the parts do not add up to one whole, or when you need to compare values that are close in size. A sorted bar graph is clearer in all three cases.
Should a graph's y-axis always start at zero?
For bar graphs, yes, because bar length represents the value. Line graphs and scatter plots can use a narrower range, as long as the axis is clearly labeled.
What is the difference between a graph and a chart?
In everyday use the words overlap. "Graph" usually means a plot of values against axes, such as a line graph or scatter plot. "Chart" is the broader term and also covers pie charts, tables, Gantt charts and diagrams.
Plan your next chart in AFFiNE
Before you open a graph maker, write the question, sketch the chart and keep the source table in one place. You can do all three on the AFFiNE whiteboard, or download AFFiNE to work offline.
Update note (November 1, 2026): This article was first published in June 2025 and rewritten in October 2026 as our hub guide to graph makers. We added a chart-type decision table, a dated comparison of free graph makers checked against each vendor's site, a worked example with original images, a mistakes table and new FAQs. We removed the long Excel and Google Sheets walkthroughs, which now live in their own linked tutorials, along with broken tables, an outdated FAQ about ChatGPT and off-topic links. AI tools assisted with drafting, and the content was reviewed and edited by the AFFiNE team.