How to Draw a Supply and Demand Graph (Step by Step)
To draw a supply and demand graph, put price on the vertical (y) axis and quantity on the horizontal (x) axis, plot a downward-sloping demand curve and an upward-sloping supply curve from a price-quantity table, and mark the point where they cross as the equilibrium price (P*) and quantity (Q*). Then label both axes, both curves and the equilibrium. That is the whole job; the rest of this guide shows each step with a worked example, a fill-in data table, and how to add a shift, a surplus or a shortage.
Update note (October 29, 2026): This guide was rewritten as a practical drawing tutorial with a copyable template and new diagrams. For the economics behind the curves (what shifts them, real-world cases and the aggregate model), read our companion guide, supply and demand graph: curves, equilibrium and examples.
Short version
- Axes: price on y, quantity on x. Swapping them is the most common mistake.
- Curves: demand slopes down (buyers want more when the price falls), supply slopes up (sellers offer more when the price rises).
- Equilibrium: where quantity demanded equals quantity supplied. Mark it with dashed lines to both axes.
- Shifts: draw a new curve (D2 or S2) and keep the old one dashed; do not move along the old curve.
What you need before you draw
You need one table with three columns: price, quantity demanded and quantity supplied. Each row is one price. In an assignment the table is usually given; for your own analysis, collect it first, because a curve is only as accurate as the numbers behind it.
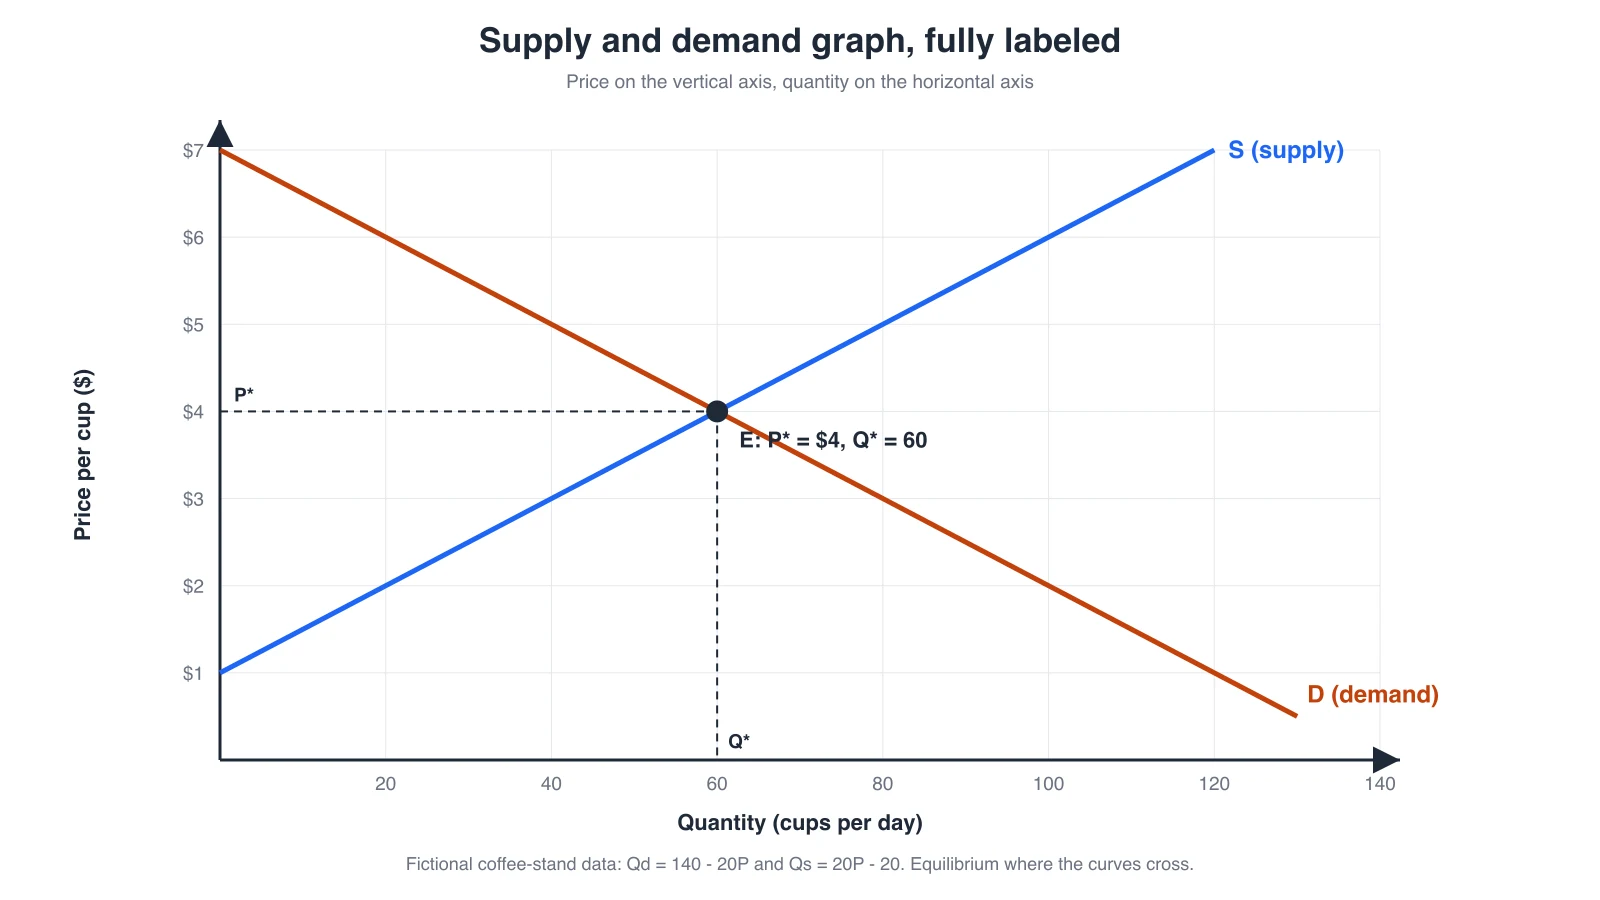
The example below is fictional: a campus coffee stand where daily demand is Qd = 140 - 20P and supply is Qs = 20P - 20.
| Price per cup (P) | Quantity demanded (Qd) | Quantity supplied (Qs) | Market condition |
|---|---|---|---|
| $1 | 120 | 0 | Shortage of 120 |
| $2 | 100 | 20 | Shortage of 80 |
| $3 | 80 | 40 | Shortage of 40 |
| $4 | 60 | 60 | Equilibrium |
| $5 | 40 | 80 | Surplus of 40 |
| $6 | 20 | 100 | Surplus of 80 |
If you are building the table in a doc first, our table creator guide covers clean column setup.
How to draw a supply and demand graph, step by step
1. Draw and label the axes
Draw an L shape. Label the vertical axis "Price" (with units, such as $ per cup) and the horizontal axis "Quantity" (such as cups per day). Economists put price on the vertical axis by convention, even though price is the variable that drives quantity.
2. Choose a scale that fits the table
Mark even intervals that cover the lowest and highest values in your table. For the coffee example, $1 to $7 on the price axis and 0 to 140 on the quantity axis leave a little space above the top row.
3. Plot the demand curve
For each row, place a point at (quantity demanded, price): (120, $1), (100, $2) and so on. Connect the points and label the line D. It should slope down from left to right. If it slopes up, you have probably plotted supply or swapped the columns.
4. Plot the supply curve
Repeat with quantity supplied: (0, $1), (20, $2) and so on. Connect them and label the line S. It should slope up from left to right.
5. Mark the equilibrium
Find the point where D and S cross. In the table it is the row where Qd equals Qs: $4 and 60 cups. Draw a dot, label it E, and draw dashed lines from E to each axis, labeled P* and Q*.
6. Add a title and check it
Give the graph a title that names the market ("Daily market for coffee at the campus stand"). Then run the checklist further down. A grader or reader should understand the graph without reading your paragraph.
How to find the equilibrium with algebra
When you have equations instead of a table, set quantity demanded equal to quantity supplied and solve for price:
- 140 - 20P = 20P - 20
- 160 = 40P, so P* = $4
- Substitute back: Qd = 140 - 20(4) = 60 cups, and Qs = 20(4) - 20 = 60. Both match, so the answer is correct.
Use the algebra to check your drawing. If the curves on paper cross somewhere other than ($4, 60), the scale or a plotted point is off.
How to show a shift in demand or supply
A change in the good's own price moves you along a curve. A change in anything else that affects buyers or sellers (income, the price of a related good, input costs, the number of sellers) shifts the whole curve. To draw a shift:
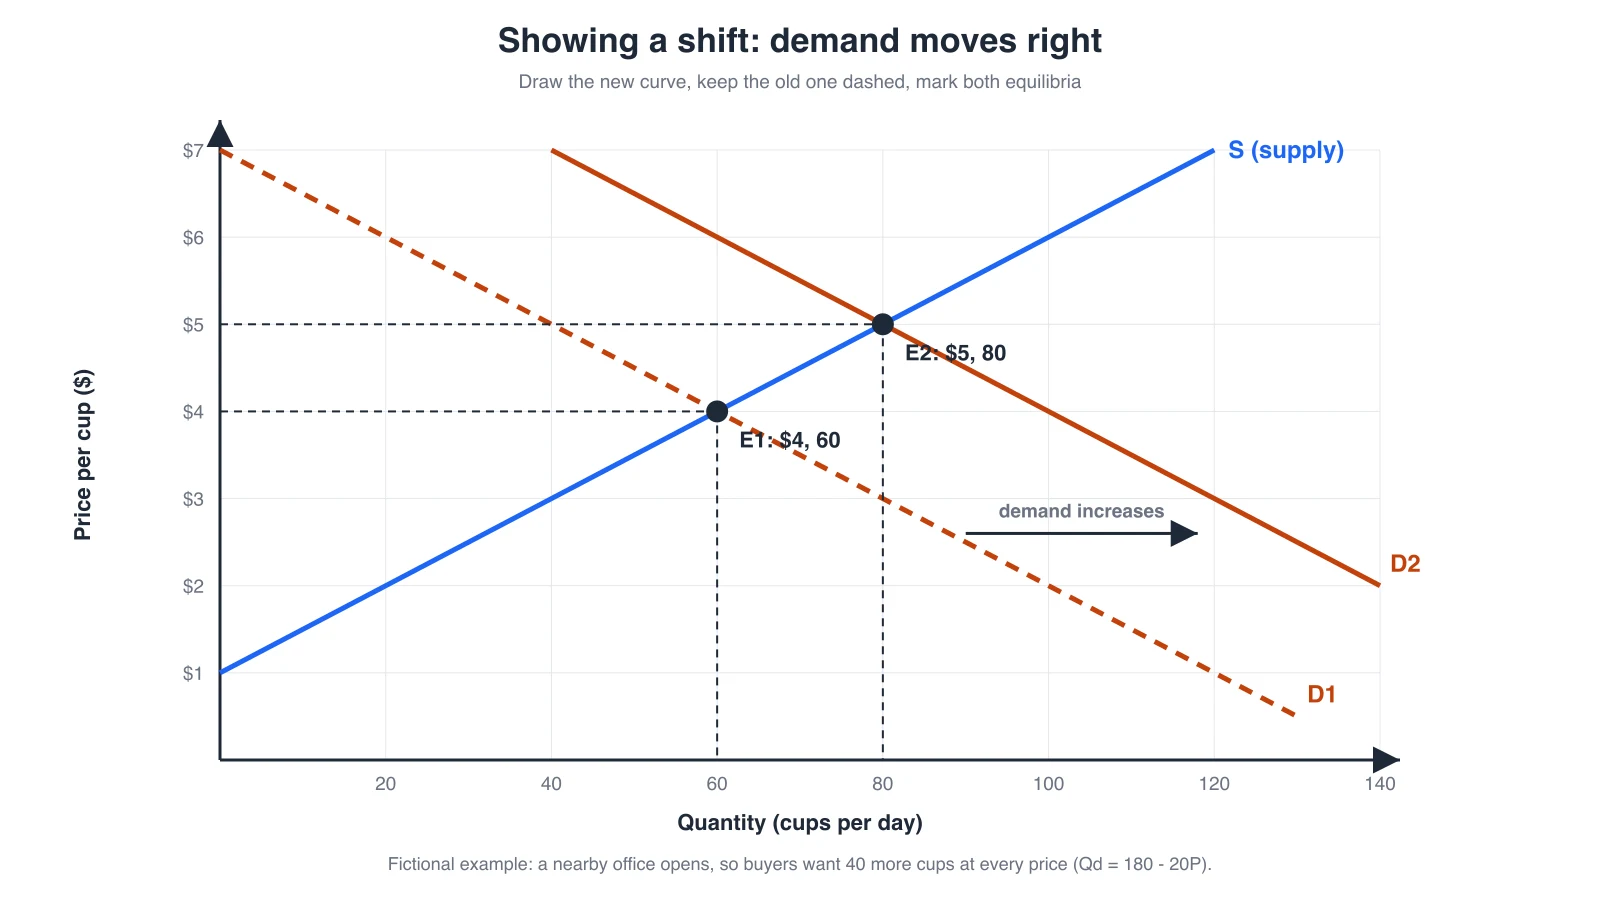
- Keep the original curve, dashed, and label it D1 (or S1).
- Draw the new curve parallel to it: to the right for an increase, to the left for a decrease. Label it D2 (or S2).
- Mark the new equilibrium E2 and draw its dashed lines to both axes.
- Add an arrow between the curves showing the direction.
In the fictional example, a new office opens next to the stand and buyers want 40 more cups at every price, so demand becomes Qd = 180 - 20P. The new equilibrium is $5 and 80 cups.
For a supply decrease, the same method applies: S2 sits to the left of S1, price rises and quantity falls. When both curves shift at once, draw both new curves; the direction of either price or quantity will be clear, and the other depends on which shift is larger. For a fuller list of what shifts each curve, see the shift determinants in our supply and demand concept guide.
How to mark a surplus or shortage
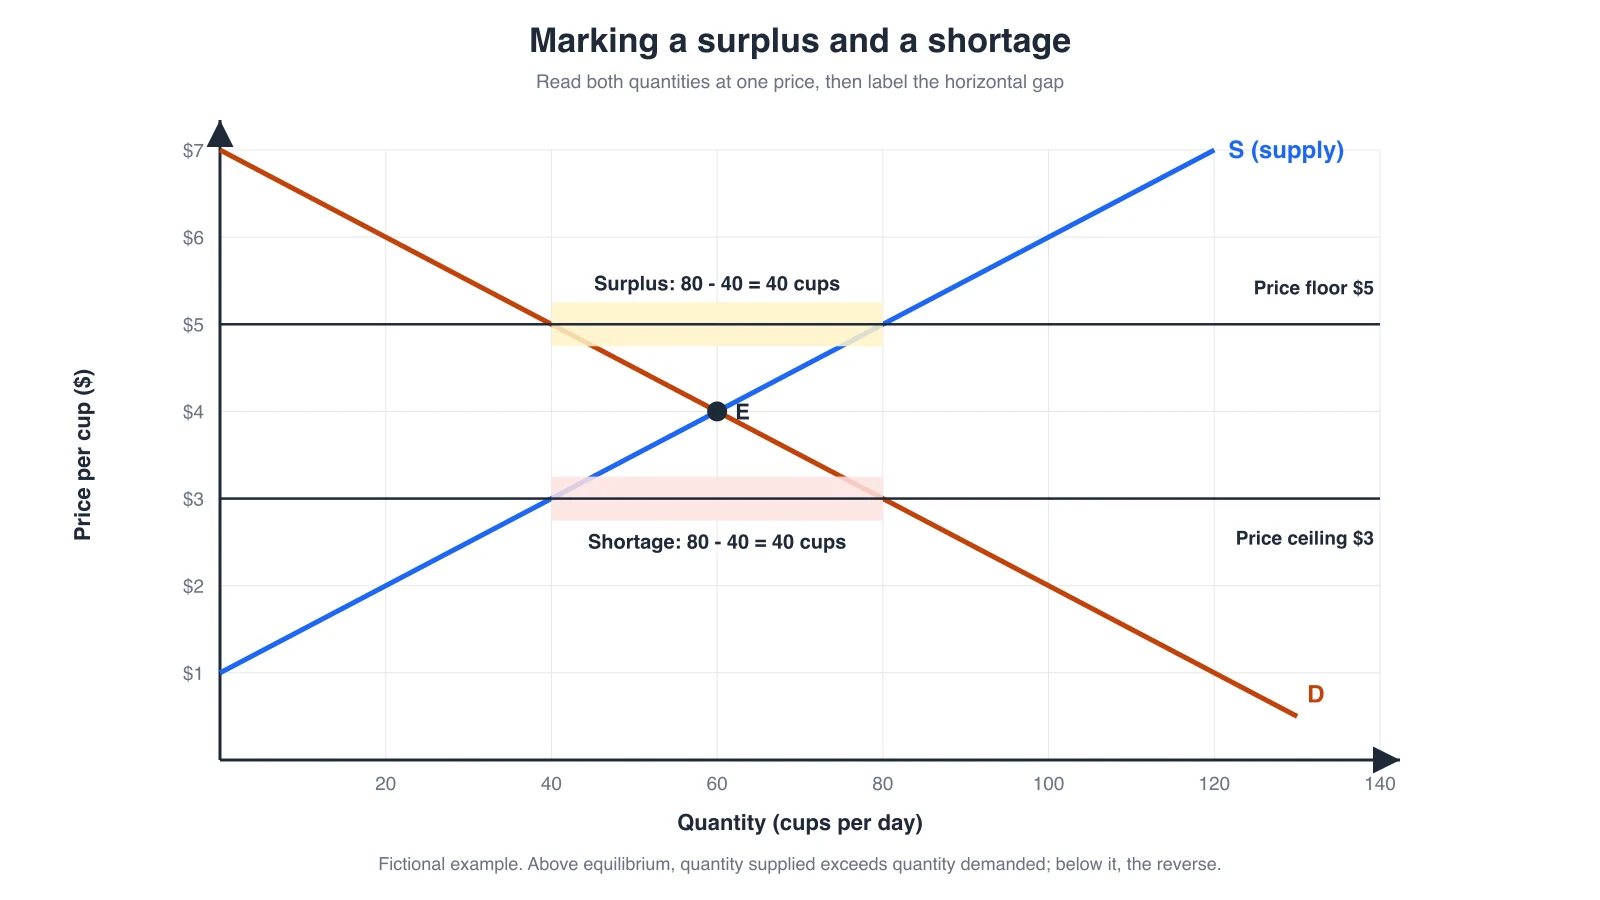
Draw a horizontal line at the price you are asked about, read where it meets each curve, and shade or bracket the gap between them.
- Above equilibrium (for example a $5 price floor): sellers offer 80 cups but buyers want 40, a surplus of 40.
- Below equilibrium (for example a $3 price ceiling): buyers want 80 cups but sellers offer 40, a shortage of 40.
Labeling checklist and common mistakes
- Price on the vertical axis, quantity on the horizontal axis, both with units
- Demand slopes down and is labeled D; supply slopes up and is labeled S
- Equilibrium marked E, with P* and Q* on the axes
- Shifted curves labeled D2 or S2, original curve dashed, arrow showing direction
- Surplus or shortage bracketed at a stated price
- Title names the market and time period
The mistakes graders see most often are swapped axes, unlabeled curves, describing a price change as a shift of demand, and drawing a shifted curve that is not parallel when the question describes an equal change at every price.
Make the graph in Excel, Google Sheets or a whiteboard
Excel or Google Sheets. Use a scatter chart, not a line chart, because each curve needs its own quantity values on the horizontal axis. Put quantity in the X column and price in the Y column, add demand and supply as two series, and in Excel choose the scatter version with straight lines so each series is drawn as a connected line. In Google Sheets, pick Scatter in the chart editor and add a linear trendline to each series. Add axis titles in both tools. Our line graph maker guide covers axis formatting that also applies here.
Whiteboard or hand drawing. For class notes and shift diagrams, drawing is often faster than a spreadsheet, because you only need the shape and the labels, not exact data. In AFFiNE you can draw the axes and curves with shapes and connectors on an Edgeless whiteboard and keep the data table and your written explanation in the same doc in Page mode. If you mainly need a quick data chart rather than an economics diagram, see our graph maker guide and chart maker roundup; for category comparisons, how to make a bar graph is a better fit.
Copyable template
Copy this into a doc, replace the example values, and draw from it.
Title: Market for <good>, <place>, <time period>
Axes: y = Price (<unit>), x = Quantity (<unit per period>)

Price | Qd | Qs | Condition
<P1>  |    |    |
<P2>  |    |    |
<P3>  |    |    |
<P4>  |    |    |
<P5>  |    |    |

Equations (optional): Qd = <a> - <b>P ; Qs = <c> + <d>P
Equilibrium: set Qd = Qs -> P* = ___ , Q* = ___

Shift (optional): cause = ______ ; curve = D or S ; direction = left / right
New equilibrium: P2 = ___ , Q2 = ___

Checklist: axes labeled with units | D slopes down | S slopes up |
E, P*, Q* marked | D2/S2 labeled, old curve dashed | title names market
Other supply and demand graphs you may need to draw
The same drawing steps work with different labels:
| Graph | Vertical axis | Horizontal axis | Curves |
|---|---|---|---|
| Single market | Price of the good | Quantity of the good | D and S |
| Labor market | Wage | Quantity of labor (workers or hours) | Labor demand (firms) and labor supply (workers) |
| Aggregate (macro) | Price level | Real GDP | AD and short-run AS (often a long-run AS vertical line) |
The aggregate model uses different reasoning for its slopes, so check your course notes before labeling it. Our concept guide explains the difference.
FAQ
Which axis does price go on in a supply and demand graph?
Price goes on the vertical (y) axis and quantity on the horizontal (x) axis. This is the standard economics convention used in textbooks such as OpenStax Principles of Economics.
How do you find the equilibrium on a supply and demand graph?
Find where the demand and supply curves cross, or the row in your table where quantity demanded equals quantity supplied. With equations, set Qd equal to Qs and solve for price, then substitute the price back to get quantity.
How do you show a shift in a supply and demand graph?
Keep the original curve, draw a new parallel curve to the right for an increase or to the left for a decrease, label it D2 or S2, and mark the new equilibrium. A change in the good's own price is a movement along the curve, not a shift.
Can I make a supply and demand graph in Excel or Google Sheets?
Yes. Use a scatter chart with quantity as the X values and price as the Y values, add demand and supply as two series, and connect each series with straight lines or a linear trendline. Then add axis titles and an equilibrium label.
What is the difference between this guide and a supply and demand graph explainer?
This page shows how to draw and label the graph. For what the curves mean, what shifts them and real-world examples, read our supply and demand graph concept guide.
Sources and editorial notes
- OpenStax, Principles of Economics 3e, section 3.1: Demand, Supply, and Equilibrium in Markets for Goods and Services. Accessed October 29, 2026.
- Microsoft Support, Present your data in a scatter chart or a line chart, and Google Docs Editors Help, Types of charts and graphs in Google Sheets. Accessed October 29, 2026.
- AFFiNE Docs, Page mode and Edgeless mode. Accessed October 29, 2026.
How this guide was prepared: The coffee-stand market, its equations and all three diagrams are fictional and were drawn for this article. AFFiNE makes a docs and whiteboard workspace, so we have a commercial interest in mentioning it; a spreadsheet or paper works just as well for this task. AI tools assisted with drafting, and the AFFiNE team reviewed the math and content.