Line Graph Maker: Free Tools, Multiple Lines and Examples
A line graph maker is a tool that plots values as points joined by a line, so you can see how something changes over time. For most people the best free option is Google Sheets or Excel, because the chart stays linked to the data. Use Canva for a styled graphic, RapidTables for a quick chart with no account, Datawrapper for charts embedded on web pages, and Desmos when you are graphing an equation rather than data. This guide compares those tools, shows how to set up data for one or many lines, and walks through a multi-line example.
We checked every tool in this guide on its own website or help center on November 1, 2026. The example data is fictional.
When to use a line graph
Use a line graph when the x-axis is time or another ordered, continuous scale and you care about the trend: monthly sign-ups, daily temperature, weekly website visits.
| Situation | Better chart |
|---|---|
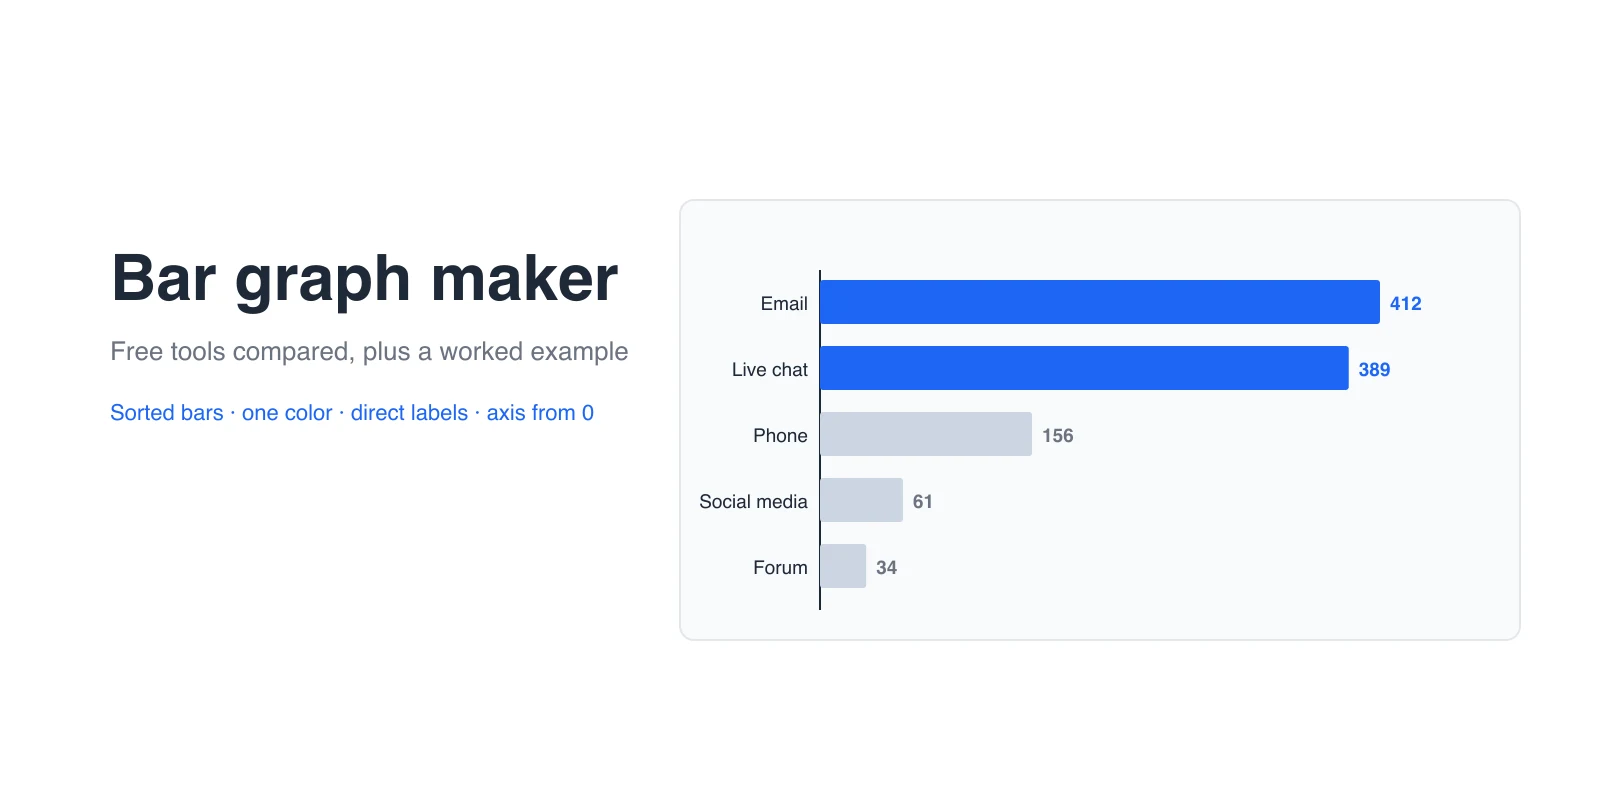
| Comparing separate categories, such as regions | Bar graph |
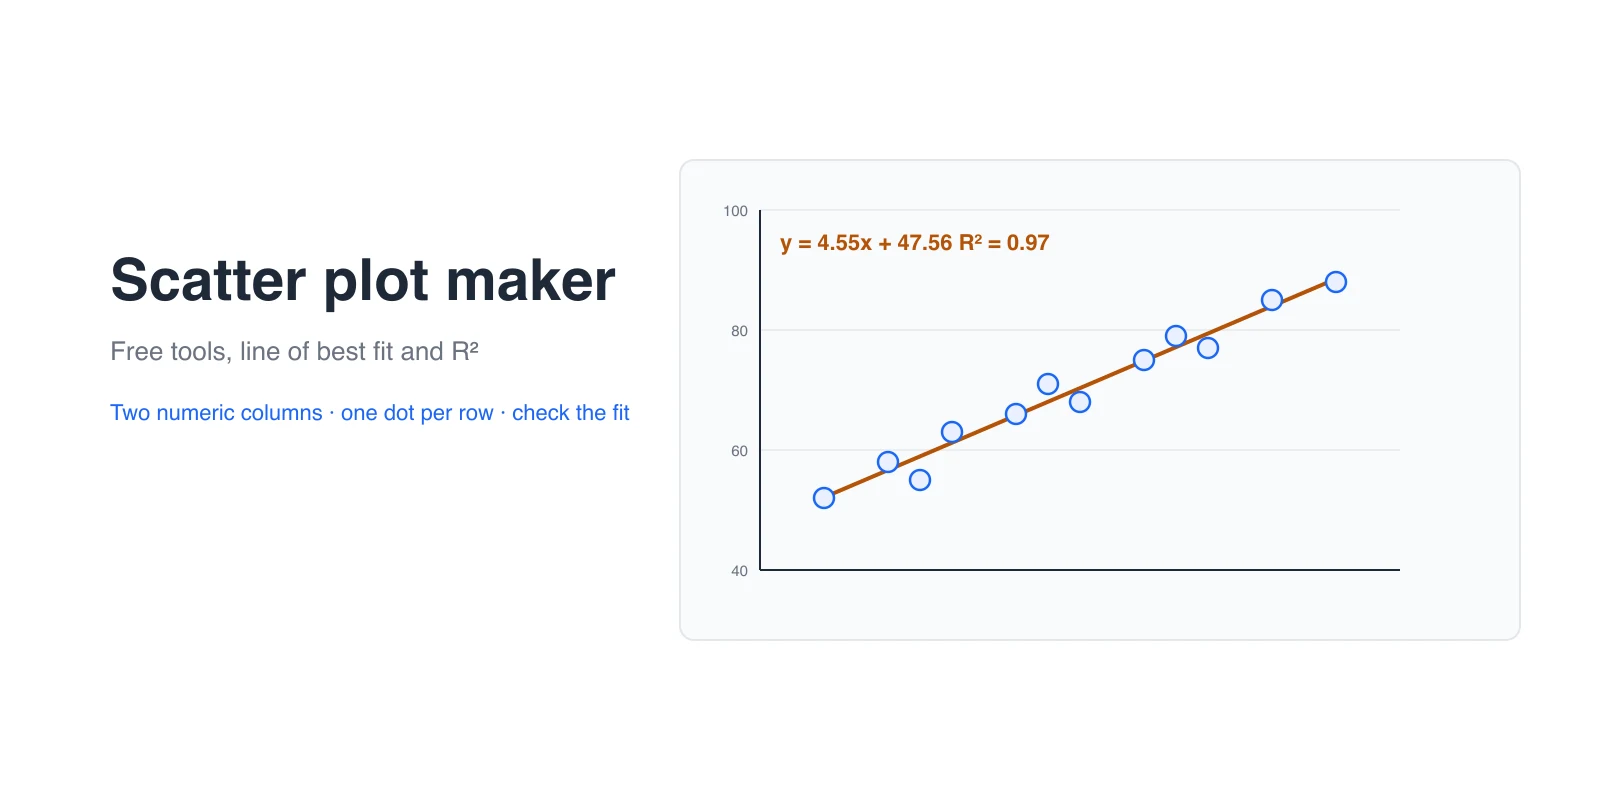
| Two numeric measurements per item, such as price and units sold | Scatter plot |
| Only two or three time points | Bar graph, or a slope chart |
| Dates are unevenly spaced | Line graph with a date axis, not text labels (see below) |
| Parts of a whole at one moment | Pie chart or bar graph |
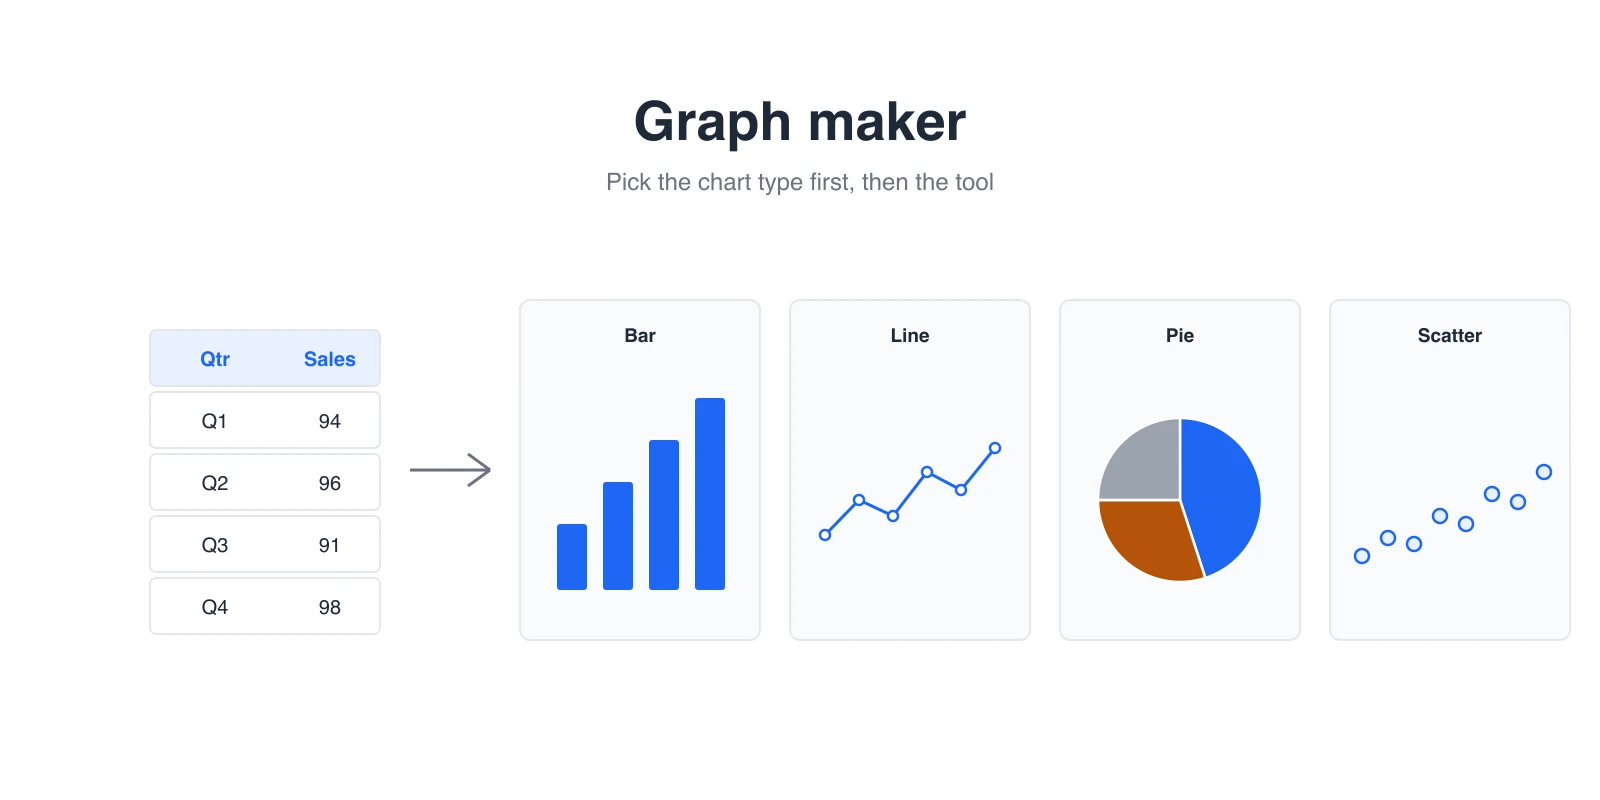
Microsoft explains the core difference well: a line chart spaces categories evenly along the x-axis, while a scatter chart places each point by its numeric x value (Microsoft Support). For other chart types, see our graph maker guide to picking the right chart.
Free line graph makers compared
Checked on November 1, 2026.
| Tool | Account needed | Multiple lines | Useful extras | Getting the chart out | Best for |
|---|---|---|---|---|---|
| Google Sheets | Google account | Yes, one column per line | Trendlines (linear, exponential, polynomial, logarithmic, power, moving average), data labels, notes | Download as PNG, PDF or SVG; embed in Docs and Slides | Shared data that changes |
| Microsoft Excel | Free for Excel for the web; desktop needs Microsoft 365 | Yes | Trendlines including moving average, markers, date axes | Copy into Office files; Save as Picture on desktop | Analysts already in Excel |
| Canva | Free account | Yes, a color per line | Templates, brand colors, legend and gridline settings | Download as PDF, JPG or PNG; add to Canva Docs | Reports and slides that need styling |
| RapidTables | None | Yes, one row of values per line | Number formats and log scale; trendlines live in its scatter plot tool | Print or save from the browser | A quick chart with no sign-up |
| Datawrapper | Free account | Yes | Annotations, highlights, date axes, log scale | Responsive embed; free plan exports PNG with attribution | Line charts on websites and in newsletters |
| Desmos | None | Yes | Regressions on table data, sliders | Share link or image | Graphing equations and math homework |
Quick picks:
- Data already in a spreadsheet: build the line graph there.
- A styled chart for a report or slide: Canva.
- No account, two minutes: RapidTables.
- A chart readers will open on their phones: Datawrapper.
- An equation such as y = 2x + 3: Desmos.
Set up your data for one or many lines
Every line graph maker expects the same layout:
- First column: the x-axis values, usually dates or periods.
- First row: a name for each line. These names become the legend or line labels.
- Each other column: one line.
| Month | Product A | Product B | Product C | Product D |
|---|---|---|---|---|
| Jan | 120 | 80 | 40 | 60 |
| Feb | 125 | 82 | 50 | 58 |
| Mar | 130 | 85 | 62 | 61 |
| Apr | 128 | 83 | 75 | 59 |
| May | 135 | 86 | 88 | 62 |
| Jun | 138 | 88 | 100 | 60 |
| Jul | 140 | 87 | 115 | 63 |
| Aug | 139 | 90 | 128 | 61 |
| Sep | 142 | 91 | 139 | 62 |
| Oct | 141 | 89 | 150 | 64 |
| Nov | 143 | 92 | 160 | 63 |
| Dec | 145 | 94 | 170 | 65 |
Fictional monthly sign-ups, in hundreds.
If your chart comes out with months as lines and products on the x-axis, the tool has read your table sideways. In Google Sheets, use Switch rows / columns on the Setup tab; in Excel, use Chart Design > Switch Row/Column.
Worked example: make four lines readable
The question is: which product is growing fastest?
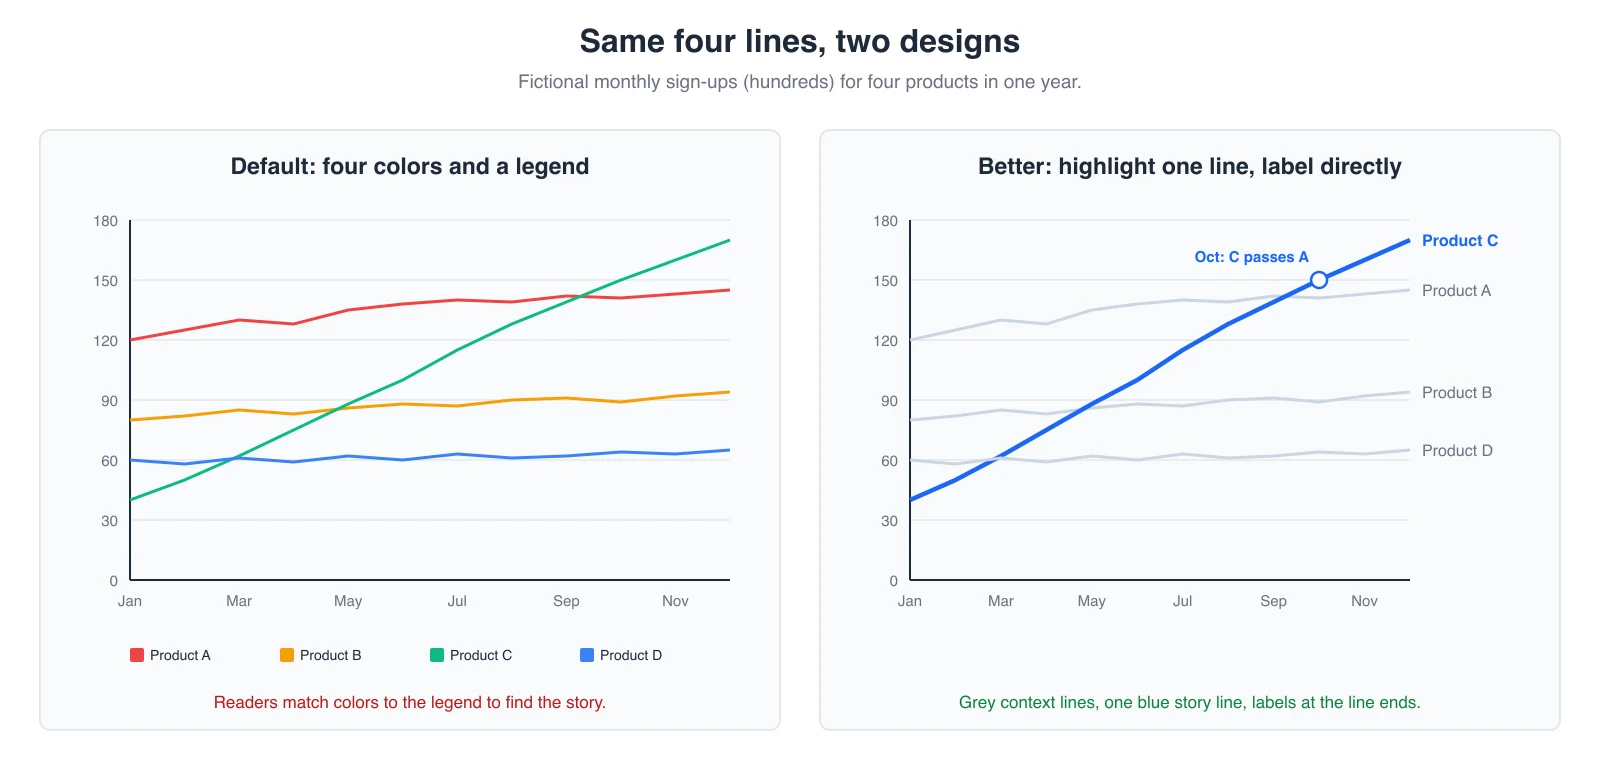
The default chart on the left is correct but slow to read. The version on the right makes three changes:
- Grey for context, one color for the story. Product C is blue; the others are light grey.
- Labels at the end of each line instead of a legend, so readers do not match colors.
- One annotation at the moment that matters: Product C passes Product A in October (150 vs 141).
The title then writes itself: "Product C overtook Product A in October."
How many lines are too many? Past four or five lines, a line graph turns into spaghetti. Highlight one or two and grey out the rest, or split the chart into small multiples: one small line graph per product, all with the same axes.
Watch out for uneven dates
If your readings were not taken at regular intervals, check how your tool spaces the x-axis.
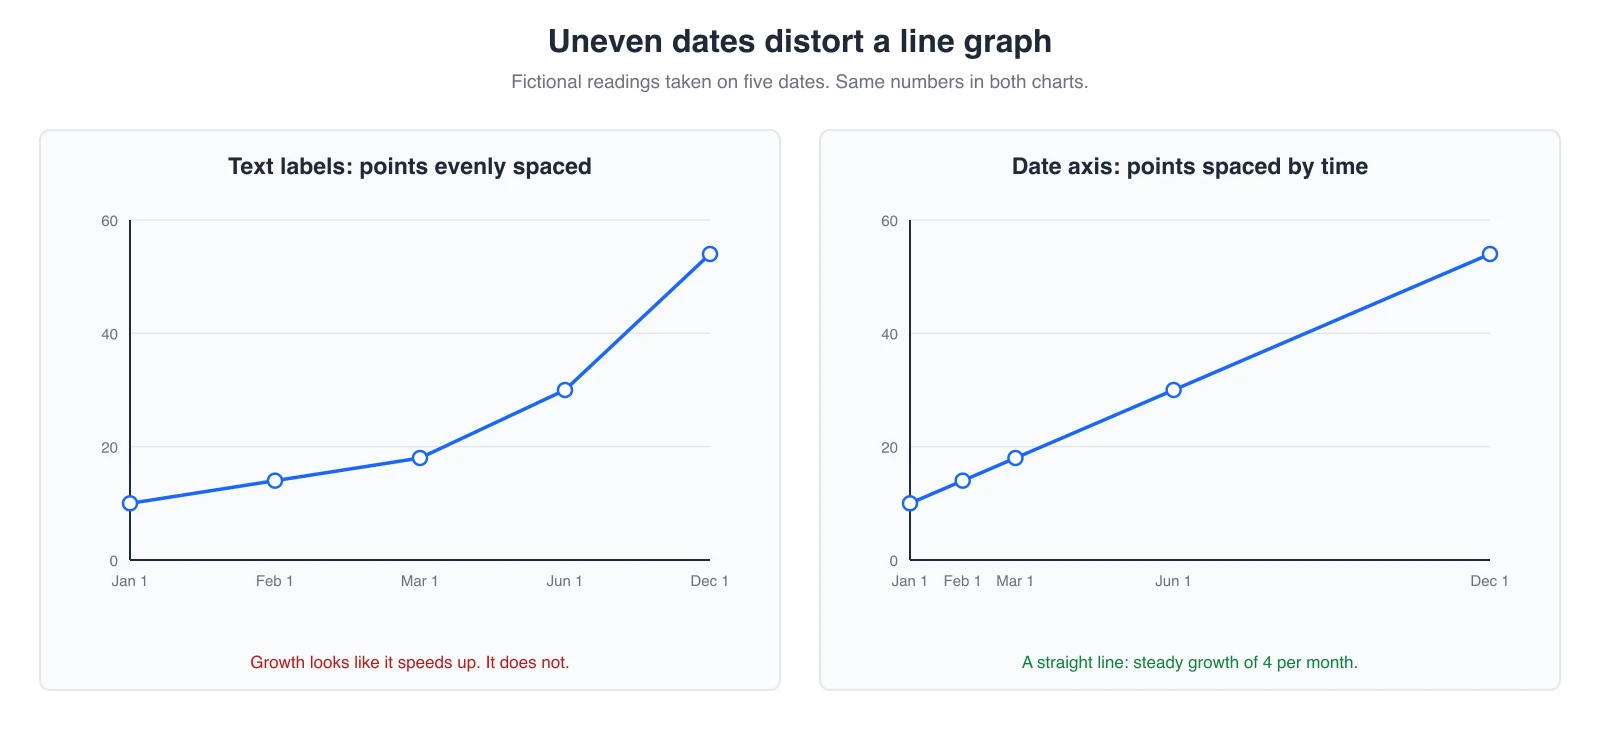
When dates are stored as text, most tools space them evenly, and steady growth looks like it speeds up. Store them as real dates (or switch to a scatter chart with lines in Excel) so the spacing matches time.
Make a line graph in Google Sheets or Excel
Google Sheets:
- Select the table, including the header row.
- Choose Insert > Chart. If Sheets picks another type, choose Line chart on the Setup tab.
- On the Customize tab, edit titles, axis labels and line colors under Series. You can also add data labels or a trendline there.
- To show a trend, open Customize > Series, tick Trendline and pick a type. A moving average smooths noisy daily data.
Excel:
- Select the table and choose Insert > Charts > Line (Line with Markers works well for monthly data).
- Use the Chart Elements (+) button to add axis titles and data labels.
- To add a trend, select the line, then Chart Design > Add Chart Element > Trendline (Microsoft Support).
Share or embed a line graph
- PNG for slides and chat, SVG for print, PDF for reports.
- Live data: publish the chart from Google Sheets (three-dot menu > Publish chart) or paste it into Docs or Slides as a linked chart, so it updates when the data does.
- Websites: Datawrapper embeds resize on phones and keep line labels readable.
- Alt text: describe the trend, such as "Product C sign-ups rose from 4,000 to 17,000 in 2026 and passed Product A in October."
Common line graph mistakes
| Mistake | Fix |
|---|---|
| More than five lines in one color scheme | Highlight one or two, grey the rest, or use small multiples |
| A legend far from the lines | Label each line at its end |
| Two y-axes with different scales | Use two charts, or index both series to 100 at the start |
| Uneven dates stored as text | Use a real date axis |
| Very thick lines or heavy markers on daily data | Thin lines; markers only for a few points |
| Smoothed curves that hide real dips | Keep straight segments, add a moving average if needed |
| A y-axis zoomed so far in that noise looks like a trend | Show enough range for context and label the axis clearly |
| Alt text that only says "line graph" | Describe the trend and the key moment |
Line graphs can start the y-axis above zero, unlike bar graphs, as long as the axis is labeled. For more on telling the story behind the line, see these data storytelling examples.
Frequently asked questions
What is the best free line graph maker?
If your data lives in a spreadsheet, Google Sheets or Excel is the best free line graph maker, because the chart updates with the numbers. Use Canva for a designed graphic, RapidTables for a quick chart without an account, Datawrapper for charts on websites, and Desmos for equations.
How do I make a line graph with multiple lines?
Put the x-axis values (such as months) in the first column and each series in its own column, with a name in the first row. Select the whole table and insert a line chart. Each column becomes one line.
Can I make a line graph online without signing up?
Yes. RapidTables makes line graphs in the browser with no account. Type your labels, enter each line's values separated by spaces, then draw and save the chart.
What is the difference between a line graph and a scatter plot?
A line graph spaces its x-axis values evenly and connects the points to show change over an ordered sequence, usually time. A scatter plot places each point by two numeric values to show whether they are related.
Should a line graph start at zero?
Not necessarily. A line graph's y-axis can start above zero when the changes you care about are small compared with the values, as long as the axis is clearly labeled. Bar graphs should always start at zero.
Should I use a line graph or a bar graph?
Use a line graph when the x-axis is time with many evenly spaced points and the trend matters. Use a bar graph when you compare separate categories, or only a few time periods that readers will compare one by one.
Can I make a curved (smooth) line graph?
Yes. In Google Sheets, open Customize > Chart style and tick Smooth. In Excel, format the data series and tick Smoothed line. Use it sparingly: smoothing can draw peaks and dips that are not in your data.
How do I add a trendline to a line graph?
In Google Sheets, open Customize > Series and tick Trendline. In Excel, select the line and choose Chart Design > Add Chart Element > Trendline. Both support a moving average for noisy data.
Keep the chart next to the explanation
A line graph usually needs a sentence or two of context: what changed, why, and what happens next. In AFFiNE you can keep the source table, the exported chart and that explanation in one doc, or compare several charts on the AFFiNE whiteboard.
Update note (November 1, 2026): This article was first published in May 2024 and rewritten in November 2026. We replaced a long, generic overview with a dated comparison of six free line graph makers checked on each vendor's site, a data layout guide for multiple lines, two original examples (highlighting one line among four, and the uneven-dates trap), sharing and alt-text guidance, and a mistakes table. We shortened the Excel and Google Sheets steps, removed unrelated links, and replaced the shared cover and unlabeled images with original graphics. AI tools assisted with drafting, and the content was reviewed and edited by the AFFiNE team.