Impact Effort Matrix: Template, Four Quadrants, and Examples
An impact effort matrix is a 2x2 grid that sorts work by how much value it should create (impact) and how much work it takes (effort). It gives you four quadrants: quick wins, major projects, fill-ins and thankless tasks. It is fast and visual, but it only helps when both axes are defined in measurable terms, scored against the same time horizon, and checked for dependencies before anyone treats a "quick win" as the first job.
This guide gives you that missing structure: a scoring rubric with real thresholds, a free template, a fully worked example with 12 initiatives, and a process for borderline items and re-scoring.
Download the Markdown template · Blank CSV register · Filled example CSV · Jump to the worked example
Quick answer
- What it is: a prioritization grid with impact on the vertical axis and effort on the horizontal axis. It is also called an impact vs effort matrix, an effort vs impact matrix or an action priority matrix.
- The four quadrants: quick wins (high impact, low effort), major projects (high impact, high effort), fill-ins (low impact, low effort) and thankless tasks (low impact, high effort).
- How to score it well: define impact as a measurable outcome at a fixed horizon, define effort as person-weeks including launch, put an evidence grade on every score, and treat a middle score as borderline instead of forcing it into a box.
- What it is not: a schedule. A quick win is a candidate. It still has to fit the strategy, have its prerequisites funded and fit the team's capacity.
What is an impact effort matrix?
An impact effort matrix is a prioritization tool that plots each initiative on two axes. Impact is the benefit you expect if the work succeeds. Effort is the time, money and coordination it takes to deliver. Splitting each axis into high and low gives four quadrants, and each quadrant suggests a default move.
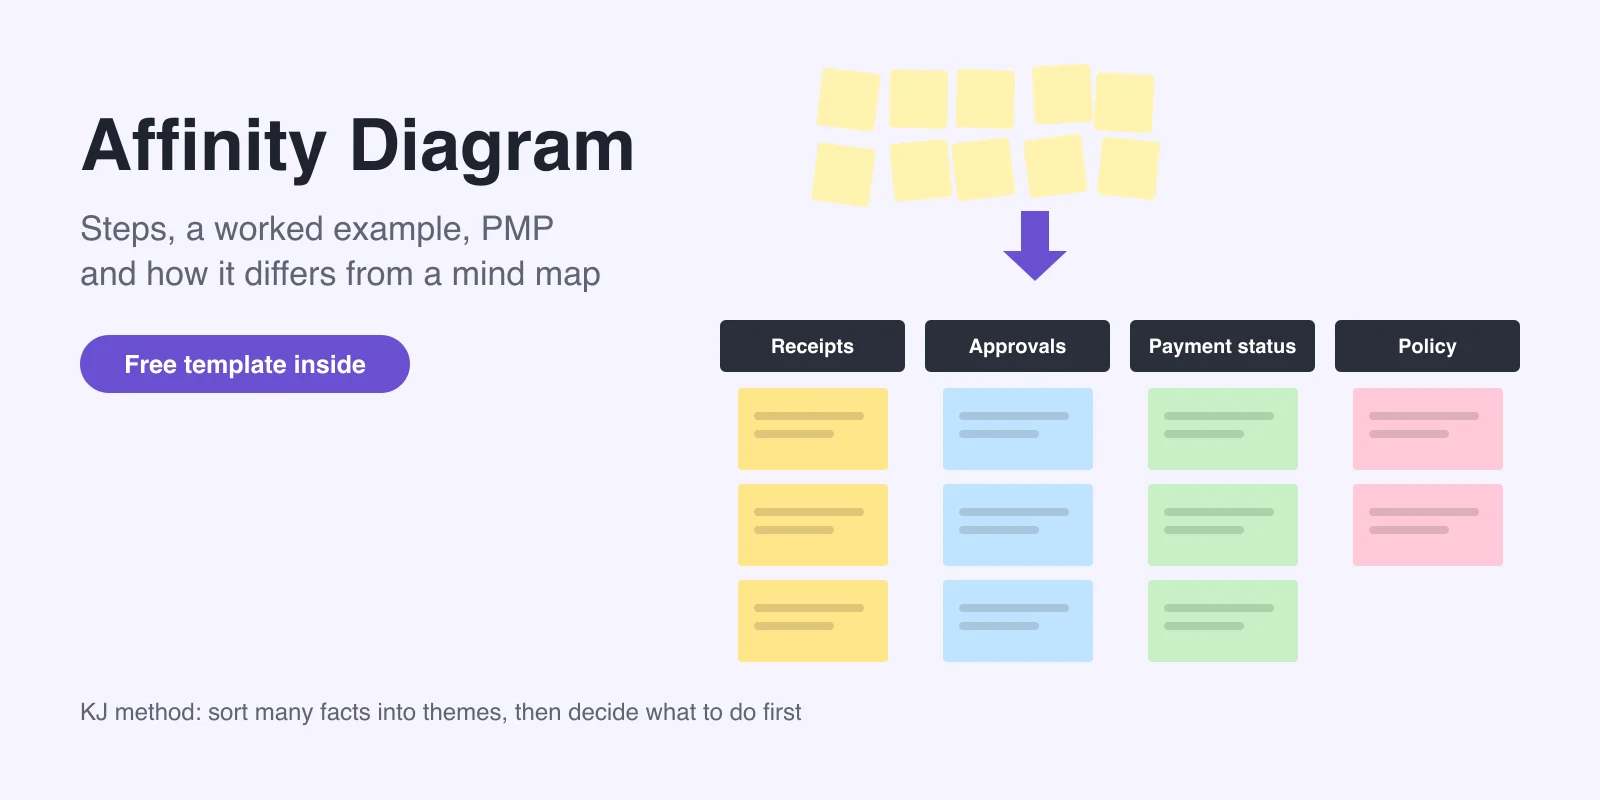
It works best when a team has more ideas than capacity and needs a shared first cut in under an hour, for example after a retrospective, a customer-feedback review or a brainstorm. If your list is still a pile of raw sticky notes, group duplicates first with an affinity diagram so you score distinct initiatives, not five versions of the same idea.
The four quadrants of the impact effort matrix
| Quadrant | Impact and effort | Default move | Watch out for |
|---|---|---|---|
| Quick wins | High impact, low effort | Candidates to do soon | Hidden prerequisites, poor strategic fit, values that only look high because costs were left out |
| Major projects | High impact, high effort | Plan, staff and sequence; test risky assumptions first | Starting more than the team can finish |
| Fill-ins | Low impact, low effort | Do only when there is slack | Comfortable busywork that crowds out real progress |
| Thankless tasks | Low impact, high effort | Drop, park or shrink the scope | Pet projects and work done because a competitor did it |
Two cautions apply to every quadrant. First, the labels describe position, not merit: an enabling task with no direct value can still be the most important thing to do this month. Second, the boundary between "high" and "low" is a choice you make in the rubric. Without one, people place items wherever their gut says, which is why the next section matters more than the grid.
How to score impact and effort with evidence
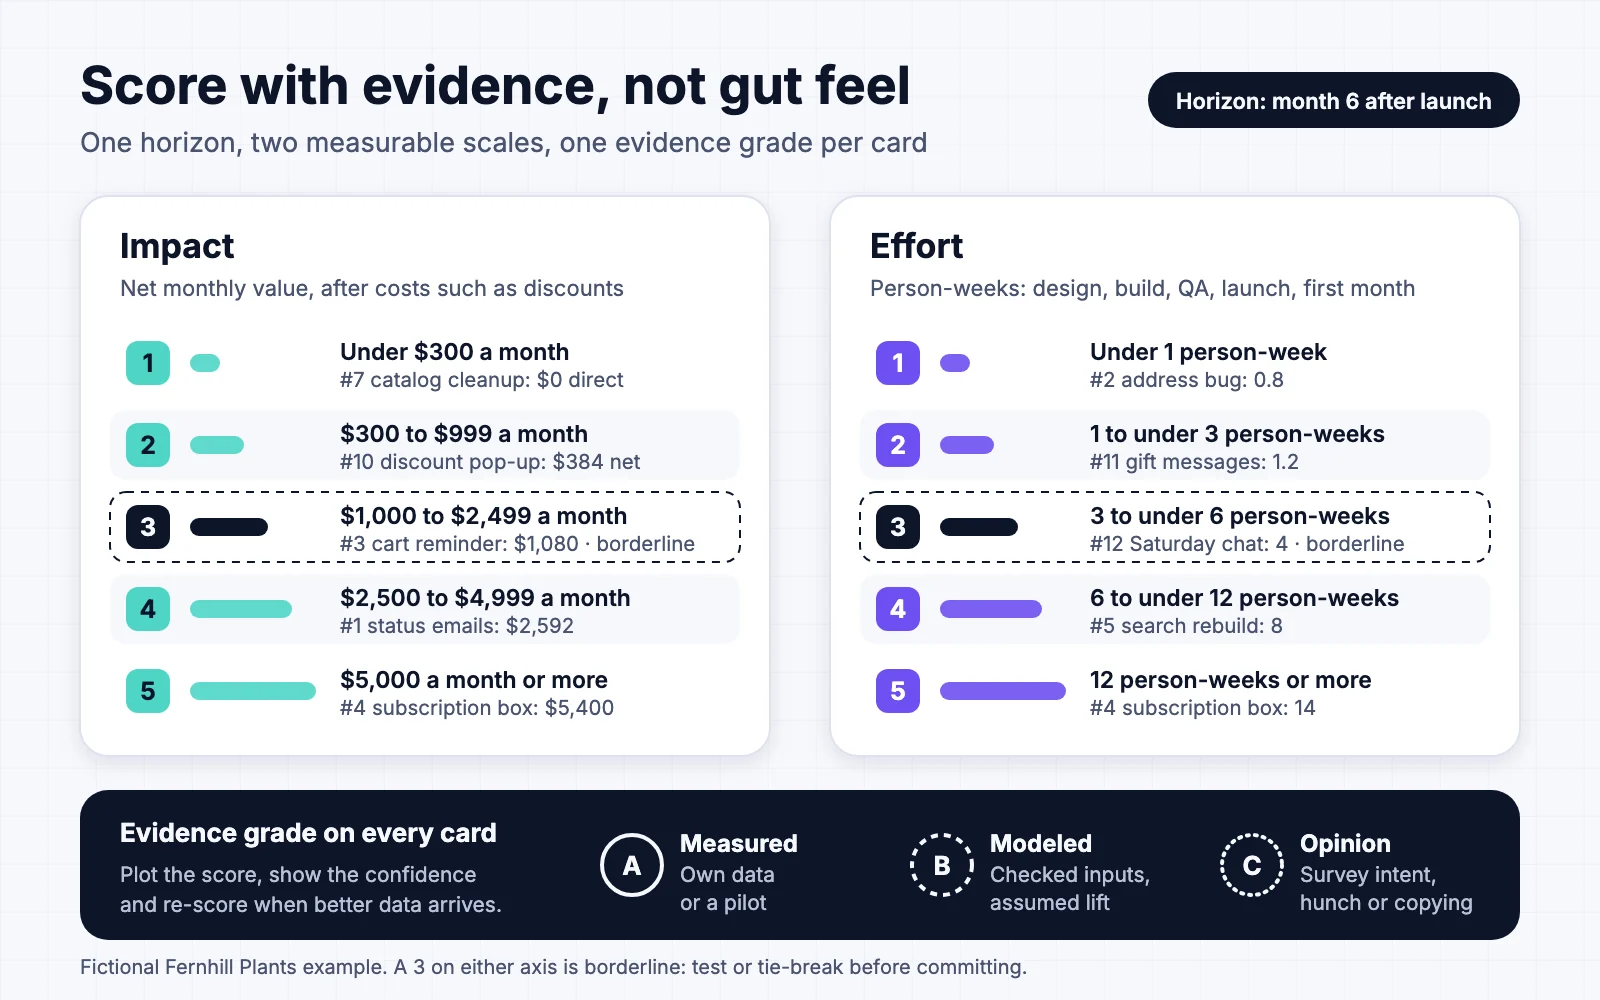
Many impact effort guides stop at "rate each item from 1 to 5" or "use T-shirt sizes". That leaves the hard part open: what does a 4 mean? Two people can both rate an idea "high impact" while picturing completely different results. A usable rubric fixes four things before anyone scores.
1. A time horizon. Impact must be measured at the same point for every item. In the example below it is month 6 after launch, and the plan covers the next 26 weeks. A loyalty program that pays back in year two and a bug fix that pays back next week are not comparable without one.
2. A unit for each axis. Pick one impact currency that fits your goal: net monthly value, hours saved, tickets avoided, sign-ups. Score it net of costs: a discount that adds orders but gives away margin should be scored on what is left. For effort, use person-weeks covering design, build, QA, launch and the first month of care, plus any prerequisite that no other funded initiative pays for.
3. Bands with numbers. Convert the unit into scores with explicit ranges:
| Score | Impact (net value a month) | Effort (person-weeks) |
|---|---|---|
| 1 | Under $300 | Under 1 |
| 2 | $300 to $999 | 1 to under 3 |
| 3 (borderline) | $1,000 to $2,499 | 3 to under 6 |
| 4 | $2,500 to $4,999 | 6 to under 12 |
| 5 | $5,000 or more | 12 or more |
These bands suit the small team in the example. Rescale them to your own size. A good test is that your largest realistic initiatives land at 5 and your smallest useful ones at 1.
4. An evidence grade on every score. The score says where to plot an item. The grade says how much to trust that position.
| Grade | Meaning | Example |
|---|---|---|
| A | Measured in your own data or a pilot | Support tags show 720 order-status tickets a month |
| B | Reasoned model with checked inputs, or comparable data | Measured cart volume, assumed 3% recovery |
| C | Opinion, survey intent or competitor copying | "31% of survey respondents said they were interested" |
When a value combines measured and modeled parts, grade it by the evidence behind the larger part. Legal, security and safety obligations skip the matrix entirely: they go on the plan because they must, not because they score well.

Impact effort matrix template
Copy these blocks into a doc or spreadsheet, or download the files at the top of this guide. The Markdown template contains the setup fields, editable rubric, a 12-row register, the quadrant grid, a pre-commit checklist and a re-score log. The blank CSV has the same 16 register columns and opens in Excel, Google Sheets or Numbers.
Setup
| Field | Your answer |
|---|---|
| Goal this matrix serves | |
| Horizon (when impact is measured) | |
| Impact unit and bands | |
| Effort unit and bands | |
| Capacity for new work in this horizon | |
| Next re-score date |
Initiative register
| ID | Initiative | Evidence | Grade | Impact | Effort | Owner | Next action |
|---|---|---|---|---|---|---|---|
| 1 | |||||||
| 2 | |||||||
| 3 |
The downloads add columns for the outcome metric, value calculation, net value, person-weeks, dependencies, quadrant, strategic fit and re-score date.
Blank matrix
| Low effort (1-2) | High effort (4-5) | |
|---|---|---|
| High impact (4-5) | Quick wins: | Major projects: |
| Low impact (1-2) | Fill-ins: | Thankless tasks: |
Borderline (a 3 on either axis): list each item with the test or tie-break that will decide it.
Worked example: 12 initiatives for a fictional plant shop
Fernhill Plants is a fictional online houseplant shop, invented for this guide. Its five-person team has 26 weeks and a goal of growing gross profit while keeping support load flat. Every figure below is an illustrative assumption, not data from a real company.
Assumptions used in every calculation
- 4,000 orders a month, $48 average order value, 50% gross margin, so $24 gross profit per order.
- 1,800 support tickets a month at $6 per ticket (9-minute average handle time at a $40 hourly loaded cost).
- 5 people x 26 weeks = 130 person-weeks, of which about 65 are free for new initiatives. The rest goes to support, operations and maintenance.
- Impact is net monthly value at month 6 after launch. Effort is person-weeks including launch and the first month.
Evidence and value
| # | Initiative | Evidence (grade) | Net value at month 6 |
|---|---|---|---|
| 1 | Shipping-status emails | 720 order-status tickets a month; a 2-week pilot on 10% of orders cut them 60% (A) | 720 x 60% x $6 = $2,592 |
| 2 | Fix mobile address-validation bug | 375 mobile checkouts a month hit the error; 40% abandon (A) | 150 lost orders x 80% recovered x $24 = $2,880 |
| 3 | Abandoned-cart reminder email | 1,500 carts a month with an email; 3% recovery assumed (B) | 1,500 x 3% x $24 = $1,080 |
| 4 | Plant-care subscription box | 31% of 600 survey respondents "interested"; no purchase data (C) | 300 subscribers x $18 margin = $5,400 |
| 5 | Search and care-filter rebuild | Search in 28% of sessions; 12% of searches return nothing; lift modeled (B) | 150 extra orders x $24 = $3,600 |
| 6 | Move to a new store platform | Quoted fee difference (B) | Fee savings = $400 |
| 7 | Catalog care-data cleanup | 41% of 600 products lack light, watering or pet-safety fields (A) | $0 direct; unlocks #5 and #9 |
| 8 | Loyalty points program | A competitor has one; 3 customer requests (C) | 40 orders x $24 minus $300 points cost = $660 |
| 9 | Pet-safety badges and filter | 240 pet questions a month measured; 70-order lift modeled (B) | 180 tickets x $6 + 70 orders x $24 = $2,760 |
| 10 | First-order 10% discount pop-up | 140 extra first orders, but 480 existing first orders would use the code too (B) | 140 x $24 minus 620 x $4.80 = $384 |
| 11 | Gift message at checkout | 55 emails a month ask for a gift note (B) | 55 x $6 + 8 orders x $24 = $522 |
| 12 | Saturday live-chat coverage | 22% of chats arrive on weekends and wait until Monday (B) | 30 saved orders x $24 = $720 |
Scores and quadrants
| # | Initiative | Impact | Person-weeks | Effort | Quadrant |
|---|---|---|---|---|---|
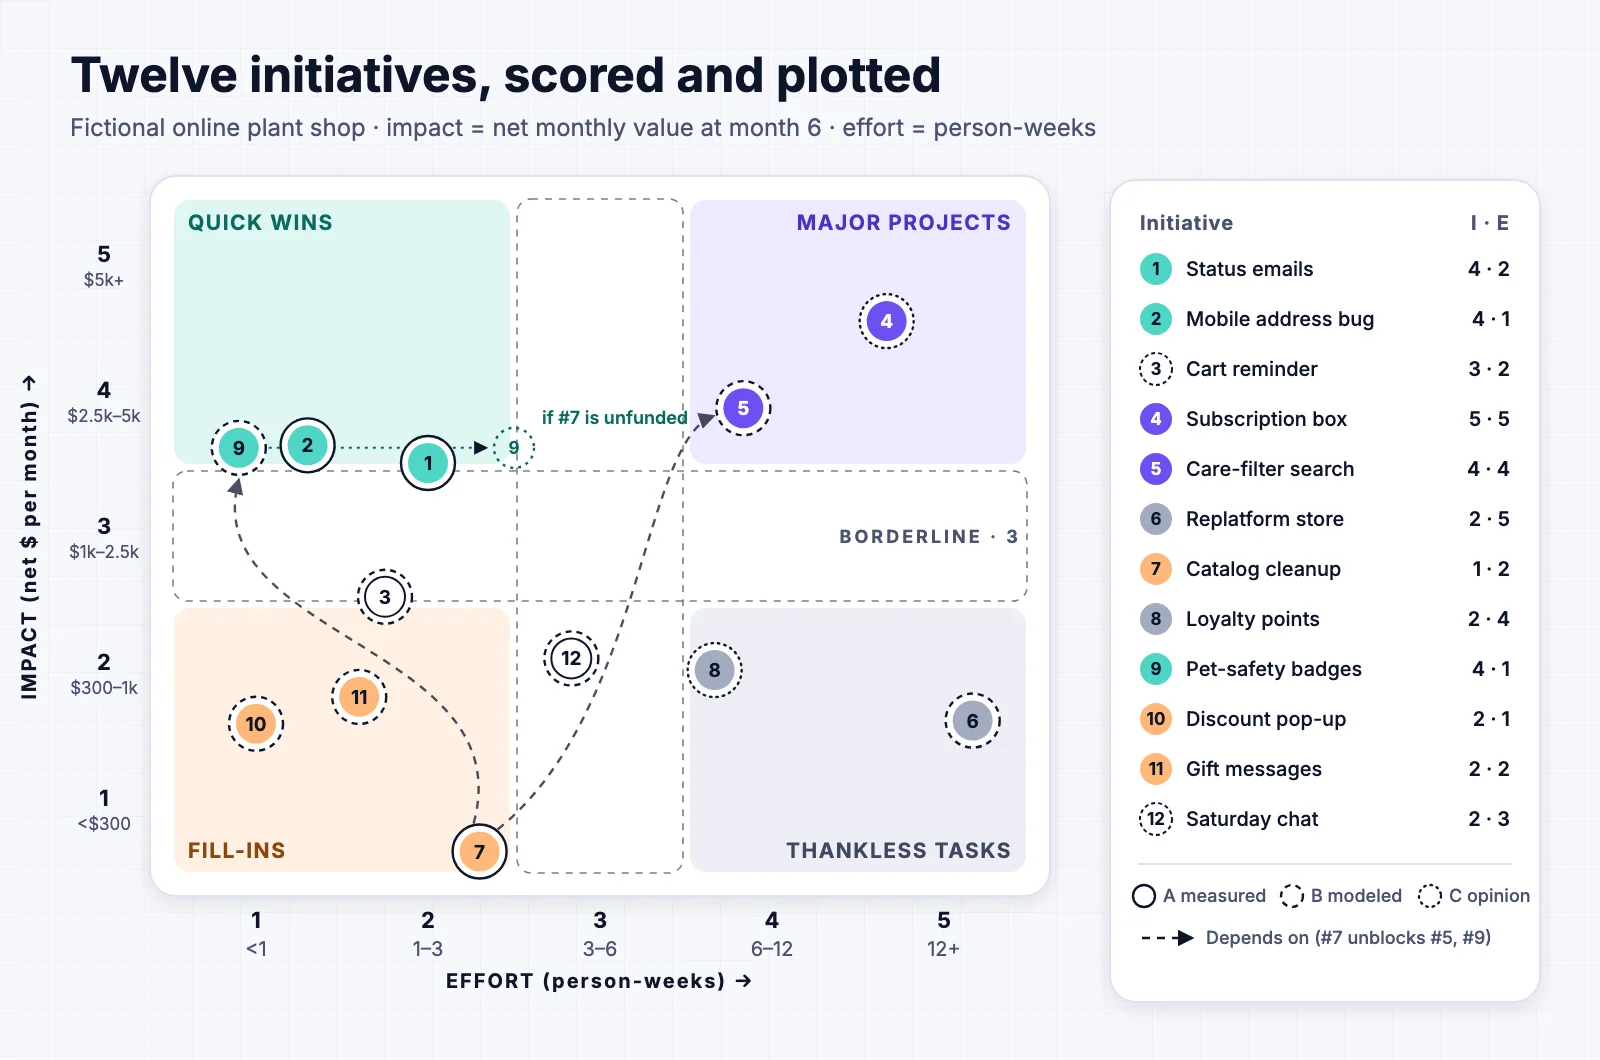
| 1 | Shipping-status emails | 4 | 2 | 2 | Quick win |
| 2 | Fix mobile address-validation bug | 4 | 0.8 | 1 | Quick win |
| 3 | Abandoned-cart reminder email | 3 | 1.5 | 2 | Borderline |
| 4 | Plant-care subscription box | 5 | 14 | 5 | Major project |
| 5 | Search and care-filter rebuild | 4 | 8 | 4 | Major project |
| 6 | Move to a new store platform | 2 | 20 | 5 | Thankless task |
| 7 | Catalog care-data cleanup | 1 | 2.6 | 2 | Fill-in |
| 8 | Loyalty points program | 2 | 7 | 4 | Thankless task |
| 9 | Pet-safety badges and filter | 4 | 0.4 (3.0 if it must fund #7) | 1 | Quick win |
| 10 | First-order 10% discount pop-up | 2 | 0.5 | 1 | Fill-in |
| 11 | Gift message at checkout | 2 | 1.2 | 2 | Fill-in |
| 12 | Saturday live-chat coverage | 2 | 4 | 3 | Borderline |
Owners and next actions
| # | Owner | Depends on | Next action |
|---|---|---|---|
| 1 | Support lead | None | Roll out to all orders in week 1; re-score in week 6 with ticket data |
| 2 | Front-end engineer | None | Fix this week; confirm the error rate falls below 1% |
| 3 | Lifecycle marketer | None | Run a 4-week holdout test; re-score with the measured recovery rate |
| 4 | Head of merchandising | None | 3-week waitlist test; build only with 150+ sign-ups |
| 5 | Product manager | #7 | Scope once #7 is done; test a filter prototype with 5 customers |
| 6 | Operations lead | None | Do not start; revisit 6 months before the platform contract renews |
| 7 | Merchandising coordinator | None | Start in week 1, because #5 and #9 depend on it |
| 8 | Lifecycle marketer | None | Park; revisit if the 90-day repeat rate stalls after #1 and #3 |
| 9 | Front-end engineer | #7 | Ship in week 3, right after #7 |
| 10 | General manager | None | Rejected: small net value and conflicts with full-price positioning; decision logged |
| 11 | Front-end engineer | None | Backlog; pick up when a sprint has slack |
| 12 | Support lead | None | Test 4 Saturdays with a volunteer rotation, then re-score |

What the plot shows that the table hides
- All three quick wins sit just above the $2,500 cut-off. A 10% overestimate would drop #1 and #9 into the borderline band. They are still worth doing, but the team re-checks them after launch instead of assuming the forecast.
- The catalog cleanup (#7) looks like a fill-in but behaves like a foundation. It has no direct value, yet two higher-impact items cannot ship without it.
- The subscription box (#4) is the biggest prize and the weakest evidence. Its score rests on survey intent, which is why its next action is a waitlist test rather than a build.
The resulting 26-week plan
| When | Work | Person-weeks |
|---|---|---|
| Weeks 1-4 | #2 bug fix, #1 status emails, #7 catalog cleanup, #3 cart test, #4 waitlist test | 0.8 + 2 + 2.6 + 1.5 + 1 = 7.9 |
| Weeks 3-6 | #9 pet-safety badges, #12 Saturday chat test (4 Saturdays) | 0.4 + 0.6 = 1.0 |
| Weeks 5-14 | #5 search and care filters | 8 |
| Weeks 8-24 | #4 subscription box build, only if the waitlist test passes | 13 |
| Total | 29.9 of 65 |
The team commits less than half of its free capacity. That gap is deliberate: people tend to underestimate how long their own tasks will take, a pattern Buehler, Griffin and Ross documented as the "planning fallacy" (1994). Leaving room is cheaper than re-planning in week 10.
Why quick wins are candidates, not automatic first picks
High impact for low effort is attractive, and many guides say "do these first". In practice, a quick win earns its place only after three checks.
Strategic fit. Fernhill's discount pop-up (#10) shows why. On gross numbers it looks like a quick win: 140 extra first orders x $24 = $3,360 a month for half a person-week. Net of the discount given to 620 first-order customers, it is worth $384, a fill-in. Even if the net number had held up, the company's positioning as a full-price, expert-care brand would have ruled it out. Log rejected quick wins with the reason, so the idea is not re-proposed every quarter.
Sequencing. The pet-safety badges (#9) score effort 1 only because the catalog cleanup (#7) is funded first. Ship #9 before #7 and it either fails or quietly absorbs 2.6 person-weeks of data work. Order work by dependency, not by quadrant.
Capacity and momentum. Quick wins are useful early because they free capacity (#1 removes about 430 tickets a month) and show results while major projects are still in build. But a quarter made only of quick wins never delivers the bigger changes. Pair them with at least one major project that is staffed and sequenced.
How to handle borderline items
A score of 3 on either axis means "close enough to the line that the placement could flip". Forcing it into a quadrant hides that uncertainty. Use one of these moves instead.
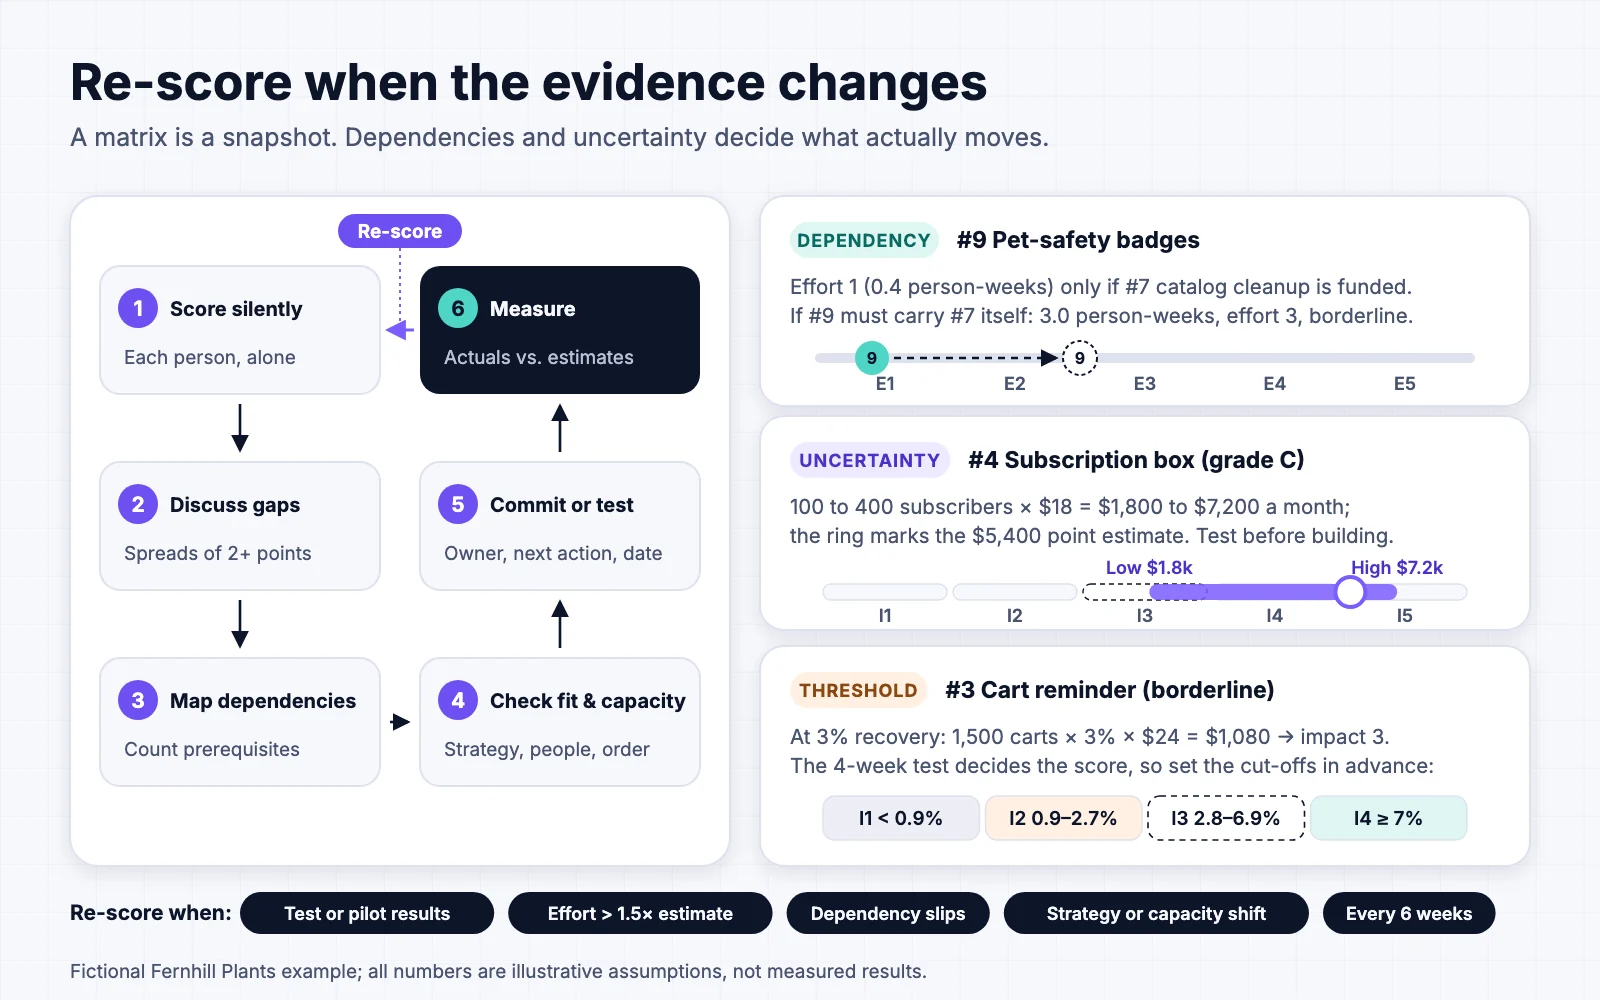
- Run a cheap test that decides the score. The cart reminder (#3) is a 1.5-person-week build, so a 4-week holdout test is affordable. Write down the cut-offs before the test: with 1,500 carts and $24 a recovered order, recovery of 7% or more is impact 4 (at least $2,500). From 2.8% to 6.9% it stays at 3. From 0.9% to 2.7% it becomes a 2, and below 0.9% it is a 1.
- Shrink the scope until it is clearly low effort. Saturday chat (#12) costs about 4 person-weeks for a full half-year. Four Saturdays of volunteer cover cost 0.6 and produce real conversion data.
- Tie-break on what else is true. Between two borderline items, prefer the one with better evidence, the one that unblocks other work, or the one that is easier to reverse.
- Re-score when the test reports, not when someone remembers.
Dependencies and uncertainty
A 2x2 grid treats every item as independent and every score as certain. Neither is true, so add two simple conventions.
Draw dependencies as arrows and count unfunded prerequisites in effort. If a prerequisite is funded for another reason, as #7 is for #5, the dependent item keeps its low effort score. If it is not, add the prerequisite's person-weeks: #9 rises from 0.4 to 3.0 and moves from effort 1 to effort 3. Delivery risks that come with dependencies, such as vendor delays or data quality, belong in a risk register; these free risk assessment templates show common formats.
Show uncertainty as a range for grade C items. The subscription box (#4) could land anywhere from 100 to 400 subscribers by month 6, so between $1,800 (100 x $18) and $7,200 (400 x $18) a month. That spans impact 3 to 5. When a range crosses a quadrant line, do not argue about the point estimate. Buy information instead: Fernhill's waitlist test costs about 1 person-week, against the 13 person-weeks the build would add.

How to run an impact effort matrix workshop in 60 minutes
Prepare one card per initiative beforehand. Each card needs the outcome it targets, the evidence available and a rough person-week estimate from whoever would do the work. Then run the session in this order.
| Step | Time | What happens | Output |
|---|---|---|---|
| 1. Agree the frame | 5 min | Confirm the goal, horizon, units and bands. Do not change them mid-session. | Shared rubric |
| 2. Score silently | 10 min | Each person scores every card alone, with an evidence grade. | Individual scores |
| 3. Reveal and discuss gaps | 15 min | Discuss only cards where scores differ by 2 or more points; the person with the outlier explains. | Agreed scores, open questions |
| 4. Plot and connect | 10 min | Place cards on the grid and draw dependency arrows. Mark borderline items. | Filled matrix |
| 5. Check fit and capacity | 10 min | Test each quick win against strategy and prerequisites; add up committed effort against capacity. | Candidate list |
| 6. Assign and schedule re-scores | 10 min | One owner, one next action and one re-score date per card. | Action table |
Silent scoring comes first for a reason. Estimates drift toward whatever number is said first, an effect Tversky and Kahneman described as anchoring (1974). Independent scores also make disagreement visible. A 2 next to a 5 usually means two people hold different information, and that conversation is the most valuable part of the session.
When and how to re-score the matrix
A matrix is a snapshot of what the team believed on one day. Re-score an item when:
- a test or pilot reports a result;
- actual effort passes 1.5 times the estimate;
- a dependency slips or is cancelled;
- strategy, budget or team capacity changes;
- six weeks have passed, even if nothing obvious changed.
Keep a short re-score log with the date, the old and new scores, what changed and the decision. Over a few cycles the log shows whether your team tends to overrate impact or underrate effort. That makes the next round of scoring better calibrated. Store it with the rest of the project record, following the same project documentation practices you use for other decisions, so the reasoning survives staff changes.
Impact effort matrix vs Eisenhower matrix vs decision matrix
These tools are often confused because several are 2x2 grids. They answer different questions.
| Tool | Question | Inputs | Best for | Limitation |
|---|---|---|---|---|
| Impact effort matrix | Which initiatives give the most value for the work? | Impact vs effort | Shortlisting a backlog of projects or improvements | Two dimensions only; ignores urgency, risk and dependencies unless you add them |
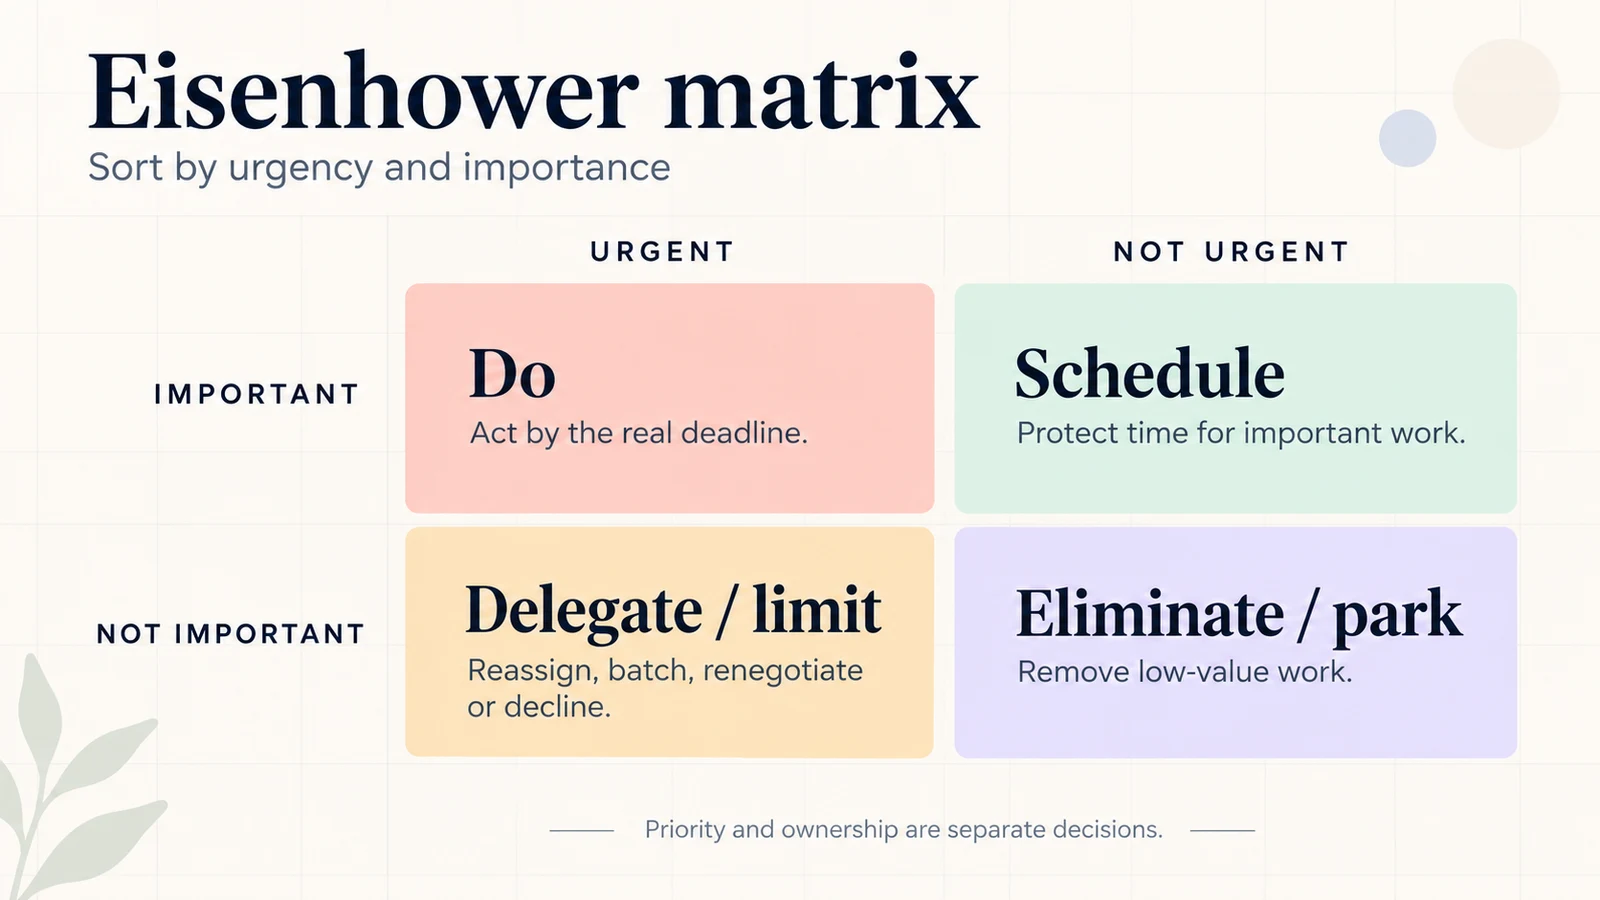
| Eisenhower matrix | What should I do, schedule, delegate or drop today? | Urgency vs importance | Personal and team task triage | Says little about payoff size or effort |
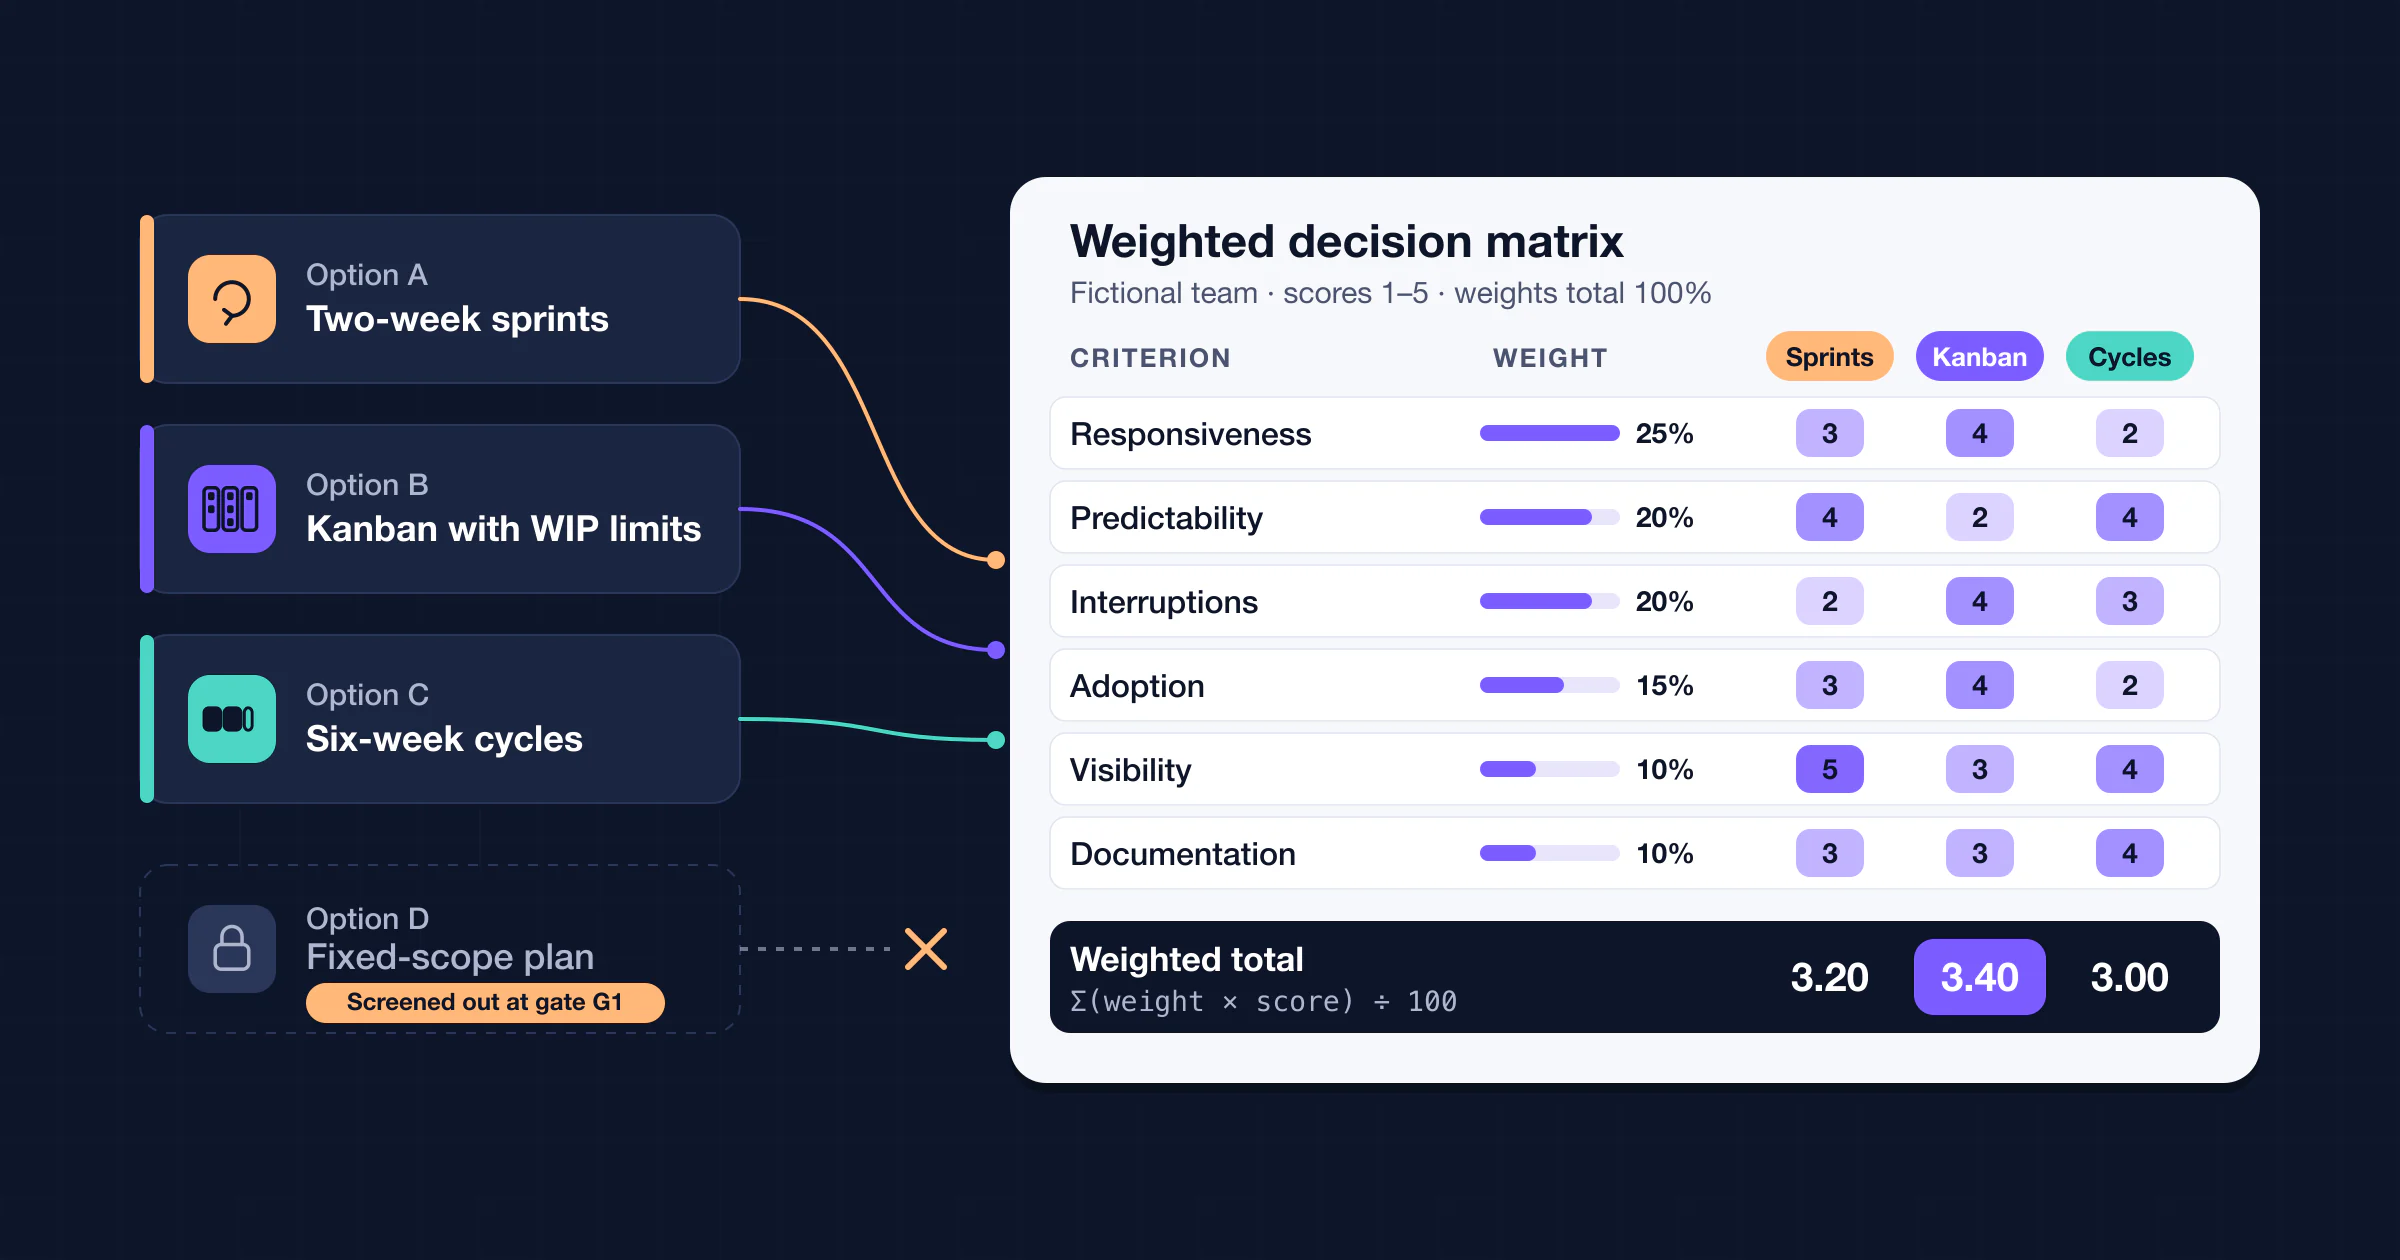
| Weighted decision matrix | Which option is best across several criteria? | Weighted scores on 3 or more criteria | Choosing between a few alternatives, such as vendors or designs | Slower; weights can be argued endlessly |
| RICE scoring | Which items give the most impact per unit of effort? | (Reach x Impact x Confidence) / Effort (Intercom, 2018) | Ranking a long product backlog numerically | False precision if the inputs are guesses |
A practical sequence is to cluster ideas, shortlist them with an impact effort matrix, and use a weighted decision matrix only for the few expensive, close calls. The Eisenhower matrix then handles the day-to-day tasks inside each chosen initiative. Once the shortlist is set, it feeds straight into your project planning phase deliverables, such as the scope, schedule and resource plan.
Limitations to keep in mind
- Scores are forecasts. The rubric makes them consistent and discussable; it does not make them accurate. Evidence grades and re-scoring are the corrective.
- Two axes hide other factors. Urgency, risk, reversibility and learning value are not on the grid. Note them on the card or use a weighted decision matrix when they dominate.
- Bands create cliffs. $2,499 and $2,500 land in different bands. That is why the 3 band is treated as borderline and why the plot shows exact positions.
- Easy-to-measure value wins by default. Support savings are easier to estimate than brand or retention effects. Do not let the matrix quietly defund work whose value is real but harder to count; flag it and decide explicitly.
How to build an impact effort matrix in AFFiNE
AFFiNE does not ship a dedicated impact effort matrix template at the time of writing: neither the website's template gallery nor the edgeless template set in its open-source code includes one. You can build one from the files above in a few minutes.
- Import the template. Choose Import, then Markdown files (.md), and select the downloaded template. When we imported this exact file in the AFFiNE web app on October 5, 2026, it became one doc with five editable tables (setup, rubric, the 16-column register, the matrix and the re-score log), a checklist and the headings. The doc takes the file name as its title, so rename it.
- Draw the grid on the canvas. Every AFFiNE doc can switch between page mode and edgeless mode, an open whiteboard canvas (AFFiNE docs). In edgeless mode, add a frame for the matrix, four shapes for the quadrants and one note or shape per initiative. Use connectors for dependency arrows.
- Keep the register next to the grid. Because the canvas and the page are the same doc, the scored table and the plotted cards stay together instead of drifting apart in two tools.
- Reuse it. Turn on the Template property in the doc's properties so the next planning cycle starts from the same rubric (AFFiNE template docs).
Sources
- Buehler, R., Griffin, D., and Ross, M. (1994). "Exploring the 'planning fallacy': Why people underestimate their task completion times." Journal of Personality and Social Psychology, 67(3), 366-381. doi.org/10.1037/0022-3514.67.3.366
- Tversky, A., and Kahneman, D. (1974). "Judgment under Uncertainty: Heuristics and Biases." Science, 185(4157), 1124-1131. doi.org/10.1126/science.185.4157.1124
- McBride, S. (January 5, 2018). "RICE: Simple prioritization for product managers." Intercom. intercom.com
- AFFiNE documentation: Page mode and edgeless mode, Templates and Frames and groups. Accessed October 5, 2026.
- AFFiNE source code on GitHub: import dialog, Markdown table adapter and edgeless template set. Accessed October 5, 2026.
- Import test: the Markdown template from this page, imported into a local (signed-out) workspace in the AFFiNE web app at app.affine.pro on October 5, 2026.
About this guide: the Fernhill Plants scenario, its numbers and all diagrams were created for this article to show the method end to end. They are not survey results, customer data or product screenshots.