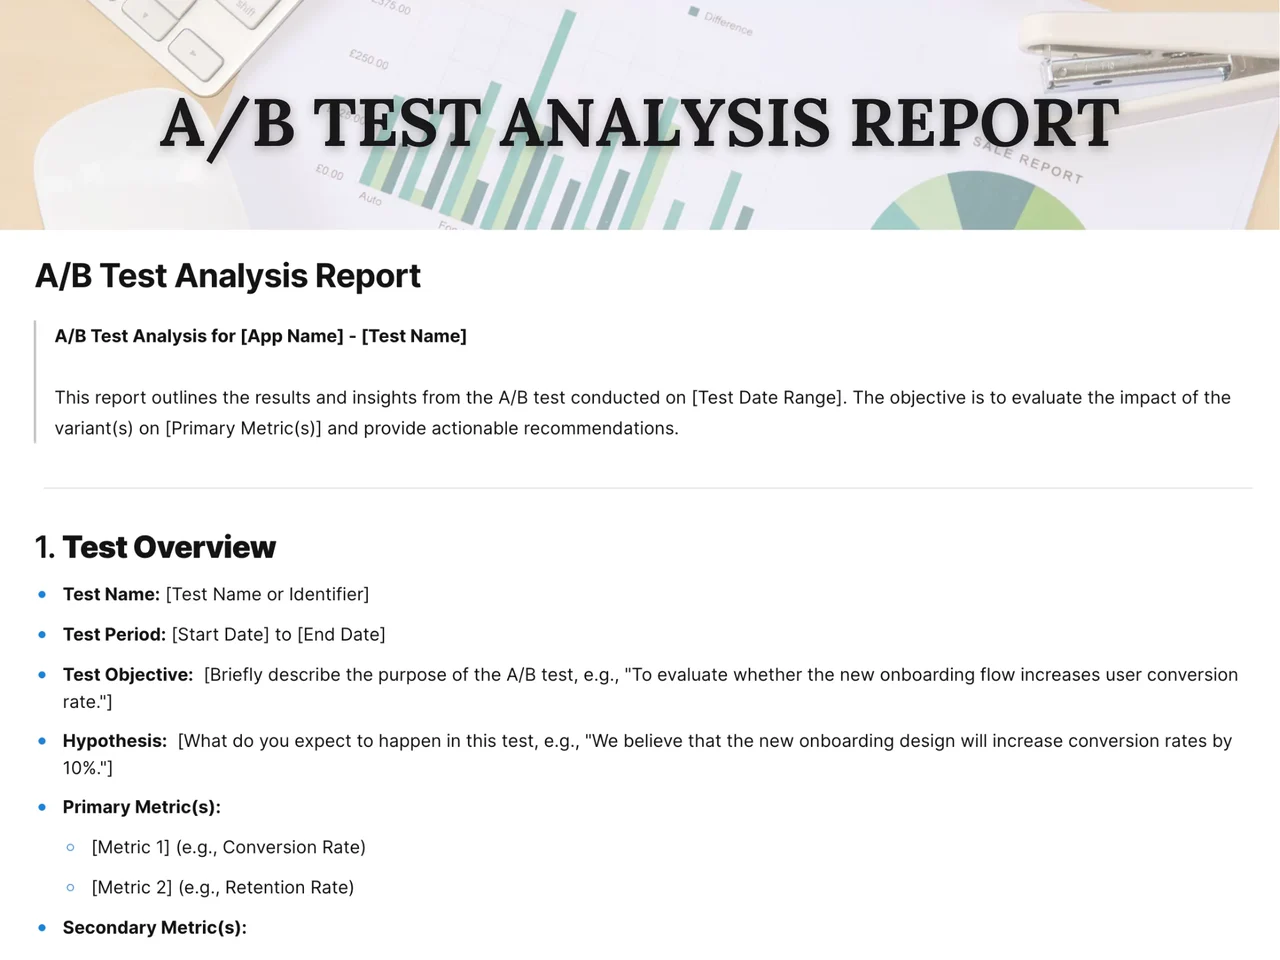
An A/B test analysis report is a document that records why an experiment was run, how it was set up, what the control and variant produced, and what the team decided as a result. This AFFiNE template gives you a ready-made page with a report header for the app and test name, a short purpose statement, and a numbered Test Overview section with fields for test name, test period, objective, hypothesis, and primary and secondary metrics, so every experiment is written up the same way.
What's included in this template
- Report header: "A/B Test Analysis for [App Name] - [Test Name]" with a one-paragraph summary of the test date range, the metric under evaluation, and the goal of giving actionable recommendations.
- Test Overview: test name or identifier, start and end dates, test objective, and a hypothesis prompt with a worked example.
- Metrics: placeholders for primary metrics (for example conversion rate and retention rate) and secondary metrics.
- Numbered report sections that continue after the overview, which you can extend with results tables, charts, and recommendations as your team needs.
When to use an A/B test analysis report
- You have finished a landing page, pricing page, or onboarding experiment and need to share the result with people who did not run it.
- You want a searchable archive of past experiments, including the ones that lost or were inconclusive, so the same idea is not retested by accident.
- You are preparing a ship or no-ship decision and need the hypothesis, metrics, and outcome on one page.
- You run product or email experiments on a regular cadence and want each write-up to follow the same structure.
How to use this A/B test analysis report in AFFiNE
- Open the template. Click Use this template to copy it into your AFFiNE workspace.
- Fill in the header. Replace [App Name], [Test Name], [Test Date Range], and [Primary Metric(s)] with your experiment details.
- Write the hypothesis before reading results. State the change, the expected effect, and the metric it should move, so the analysis cannot drift toward whatever happened.
- Record the results. Add a table with sample size, conversion rate, observed lift, and the significance or confidence figure from your testing tool for each variant.
- Add charts and context. Paste screenshots from your analytics tool, or sketch the funnel on an AFFiNE whiteboard, and note anything unusual during the test period.
- Close with a decision. Write the recommendation (ship, iterate, or stop), then share the page or export it to PDF or Markdown for stakeholders.
Tips for a clearer A/B test write-up
- Pick one primary metric before launch. Secondary metrics help explain the result, but they should not decide it.
- Plan segments in advance. Splitting by device, traffic source, or new vs. returning visitors after the fact makes false positives more likely.
- Report losing and flat tests too. A clear "no difference" result is still useful knowledge.
Frequently asked questions
What should an A/B test report include?
At minimum it should include the hypothesis, test dates, audience and traffic split, primary and secondary metrics, results per variant with sample sizes, statistical significance, and a recommendation. This template covers the overview and metrics up front so the rest of the report has a clear frame.
Does this template calculate statistical significance?
No. It is a document, not a calculator. Run the numbers in your testing or analytics tool and record the resulting p-value or confidence level in the results section.
How long should an A/B test run before you analyze it?
Run it until you reach the sample size you planned before launch, and usually for at least one full business cycle, such as a week, so weekday and weekend behavior are both included. Stopping early because a result looks good is a common cause of misleading conclusions.
Can I use this template for multivariate tests?
You can adapt it, but a test with several variables is easier to document with the multivariate test report template, which is built for comparing more than two versions.
Browse more data analysis templates, track behavior over time with the cohort analysis report template, or read about using AI for data analysis.