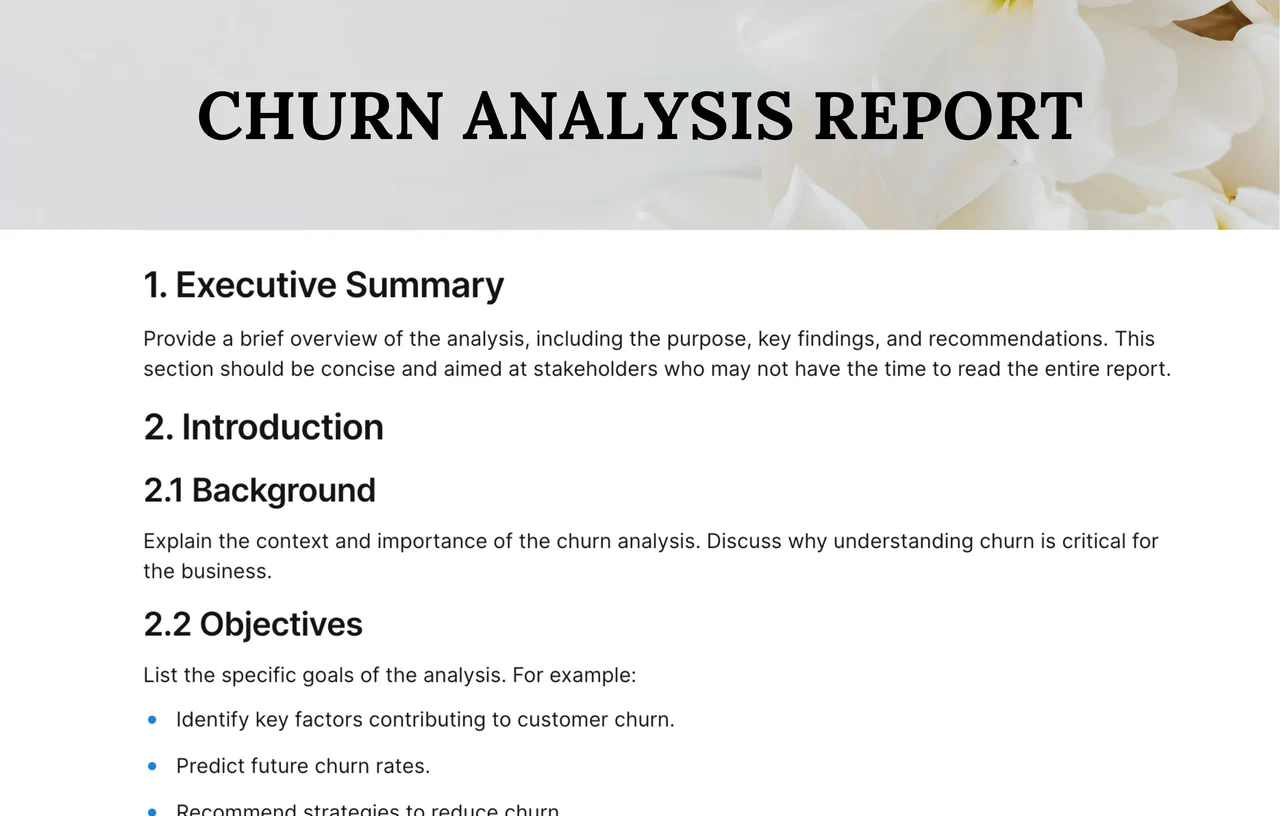
A churn analysis report is a document that measures how many customers stop buying or cancel over a period, explains why they left, and recommends actions to keep more of them. This AFFiNE template gives you a structured report page that starts with an Executive Summary and an Introduction split into Background and Objectives, with example objectives such as identifying the factors behind churn, predicting future churn rates, and recommending strategies to reduce it.
What's included in this template
- 1. Executive Summary: a short overview of purpose, key findings, and recommendations, written for stakeholders who will not read the whole report.
- 2. Introduction:
- 2.1 Background: why understanding churn matters for your business right now.
- 2.2 Objectives: example goals you can edit, including identifying key churn factors, predicting future churn rates, and recommending ways to reduce churn.
- Further numbered sections in the same report format, which you can extend with your data, findings, and a retention action plan.
When to use a churn analysis report
- Monthly or quarterly reviews of subscription or SaaS cancellations.
- Investigating a sudden rise in cancellations after a price change, product change, or outage.
- Comparing churn across customer segments, plans, or signup cohorts to find where retention is weakest.
- Presenting retention findings and a proposed plan to leadership or the customer success team.
How to use this churn analysis report in AFFiNE
- Copy the template. Click Use this template to add the report to your AFFiNE workspace.
- Define churn for your business. Write down what counts as a churned customer (canceled, not renewed, or inactive for a set number of days) and the period you are measuring.
- Calculate the churn rate. Divide customers lost during the period by customers at the start of the period, and add the figures to a table by segment or plan.
- Collect the reasons. Summarize cancellation survey answers, support tickets, and usage data, and group them into a few clear causes.
- Write the findings and plan. List the main drivers, then the retention actions, owners, and the metric each action should move.
- Summarize and share. Fill in the Executive Summary last, then share the page or export it to PDF for stakeholders.
Tips for a useful churn analysis
- Separate voluntary churn (customers who choose to leave) from involuntary churn (failed payments), because they need different fixes.
- Look at cohorts, not only the overall rate. A stable average can hide a newer signup group that leaves much faster.
- Pair numbers with quotes from exit surveys so readers understand the reasons behind the rate.
Frequently asked questions
What is included in a churn analysis report?
A typical report includes an executive summary, background and objectives, the churn definition and rate, a breakdown by segment or cohort, the main reasons customers left, and recommendations. This template starts with the summary, background, and objectives so the rest of the analysis has a clear purpose.
How do you calculate customer churn rate?
Divide the number of customers lost during a period by the number of customers at the start of that period, then multiply by 100. For example, losing 20 of 400 customers in a month is a 5% monthly churn rate.
What is the difference between customer churn and revenue churn?
Customer churn counts how many customers leave. Revenue churn measures how much recurring revenue is lost, so it also reflects downgrades and the size of the accounts that left.
Can I use this template with data from Excel or Google Sheets?
Yes. Do the calculations in your spreadsheet or BI tool, then paste the summary tables and chart screenshots into the report. The template holds the narrative and decisions, not the raw data.
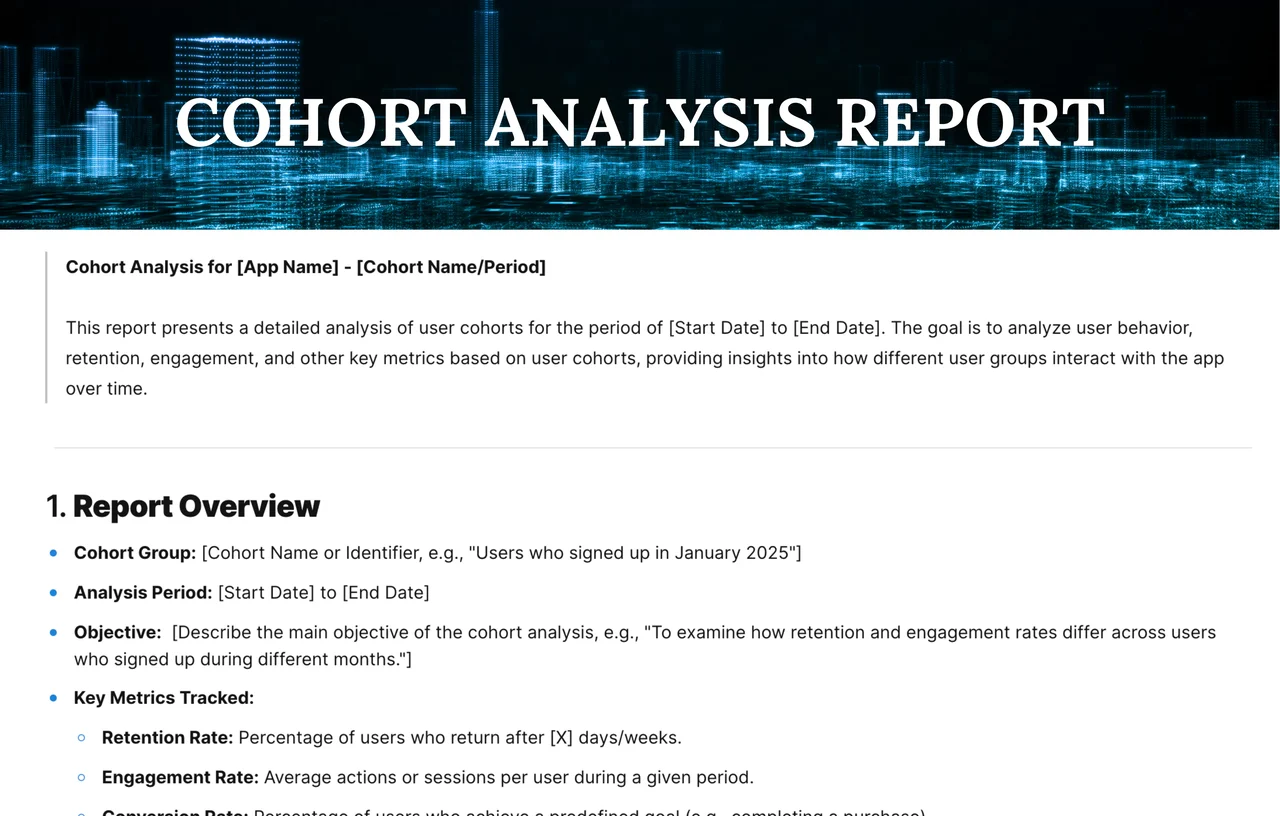
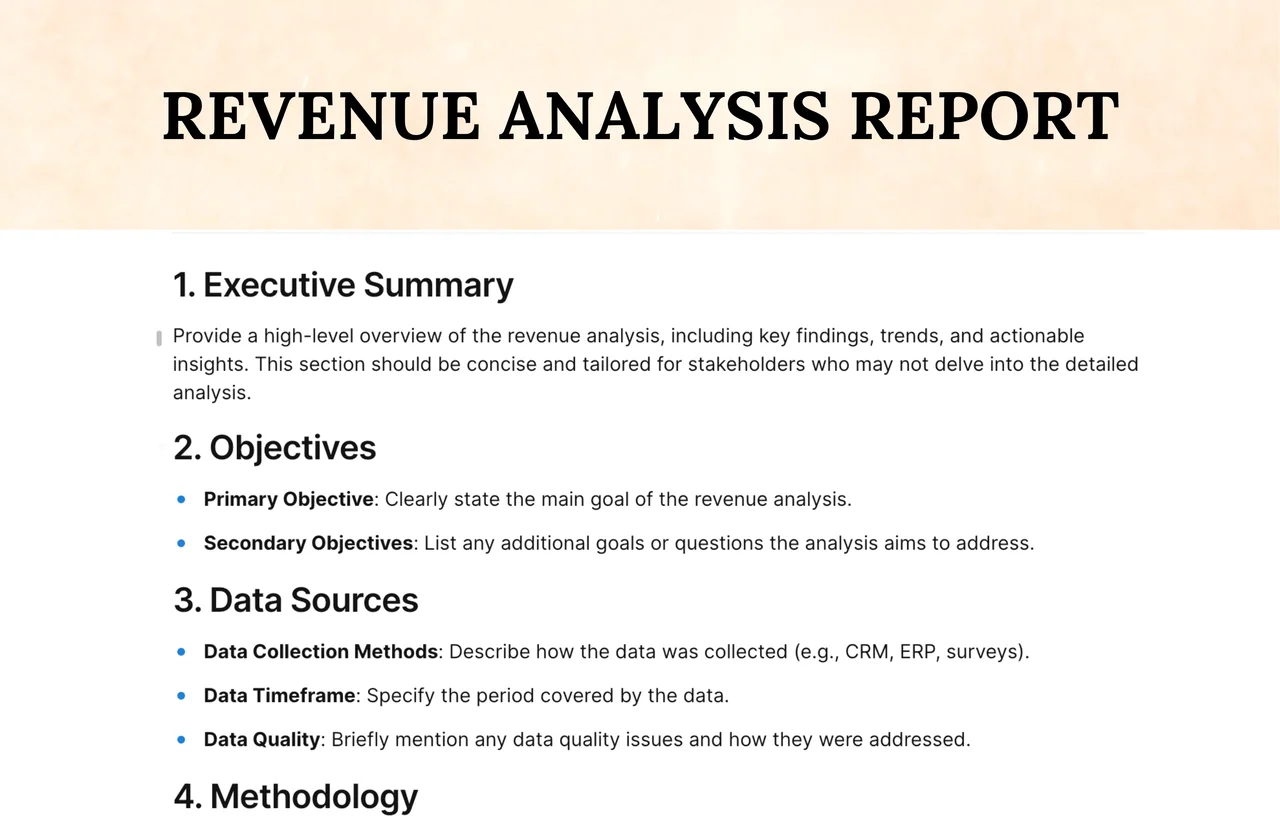
See all data analysis templates, study retention by signup group with the cohort analysis report template, check revenue impact with the revenue analysis report template, or read how to build dashboards people actually use.