Revenue Analysis Report
Free revenue analysis report template in AFFiNE with numbered sections for the executive summary, objectives, data sources, methodology, and findings.

Reviewed by AllenContent Operations Manager


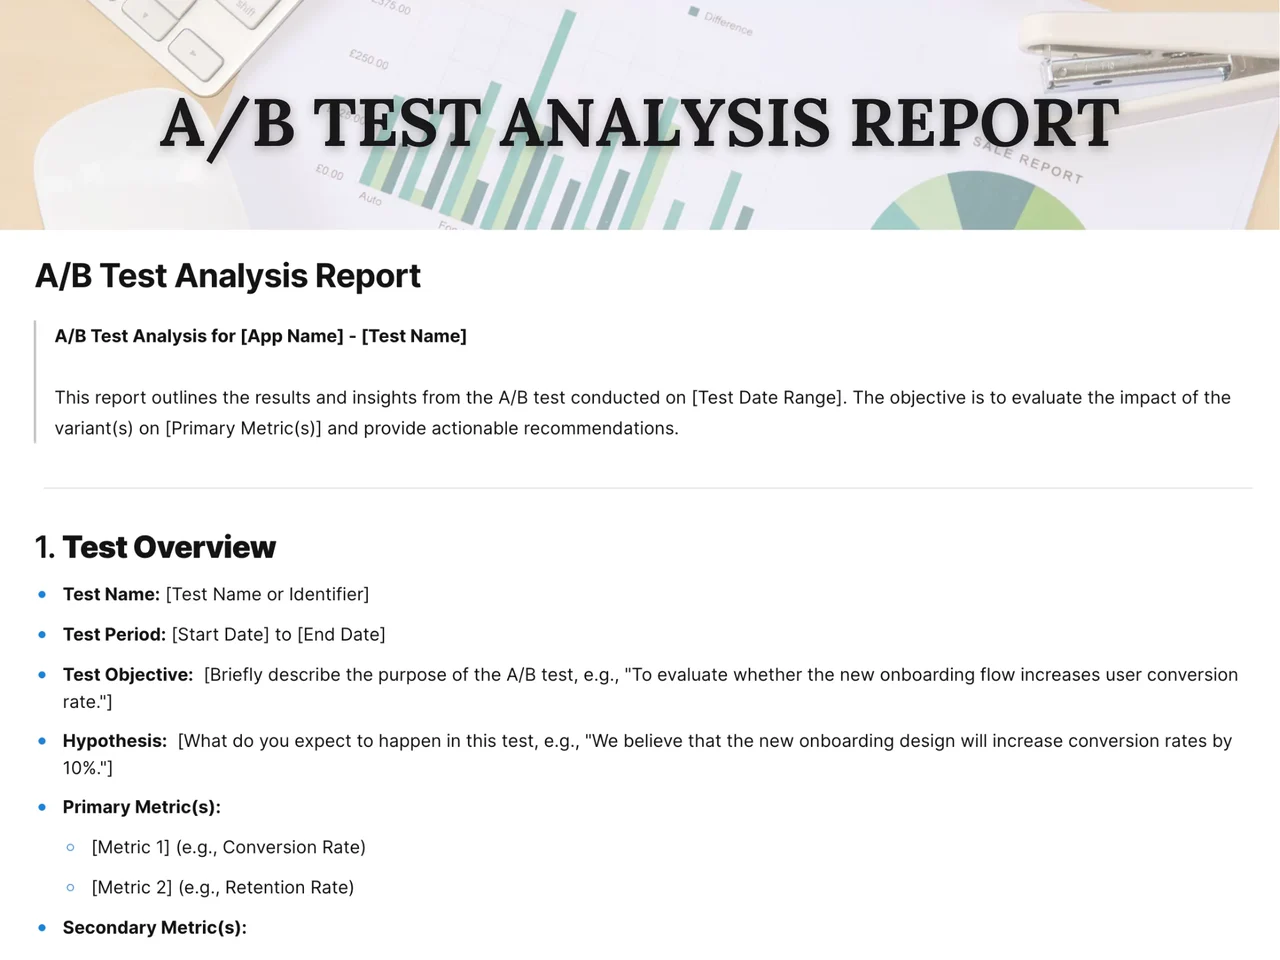


A revenue analysis report is a document that explains how much revenue a business earned in a period, where it came from, and why it changed, so stakeholders can act on the findings. This AFFiNE template is a structured report outline with numbered sections, starting with an Executive Summary, Objectives, Data Sources, and Methodology, and each section includes a prompt telling you what to write.
Revenue reporting templates on the first page of search results commonly break revenue down by product, segment, and region, and compare actual results against budget and the prior year. Useful measures include total revenue, growth rate, revenue by segment, average revenue per customer, and recurring versus one-time revenue. Pair revenue with retention data when you can; the churn analysis report template and the cohort analysis report template cover that side.
It should include an executive summary, the objectives, the data sources and timeframe, the methodology, the findings broken down by product, segment, or period, and recommendations. This template provides those sections in order.
Compare revenue across periods, against budget, and across segments such as product, customer type, or region. Then look for the causes behind the largest changes, such as price, volume, or customer churn.
Yes. You can paste images of charts or insert tables in AFFiNE. The template does not calculate figures itself, so do the math in your spreadsheet or analytics tool.
Executives, finance teams, sales leaders, and investors. Write the executive summary for readers who will stop there.
Find more report templates in the data analysis template collection, and read about progress reports for tips on writing updates for stakeholders.