Cost-Benefit Analysis Template, With a Worked Example
A copy-ready cost-benefit analysis template, the three formulas you need (NPV, benefit-cost ratio, payback), and a worked example with every number shown.

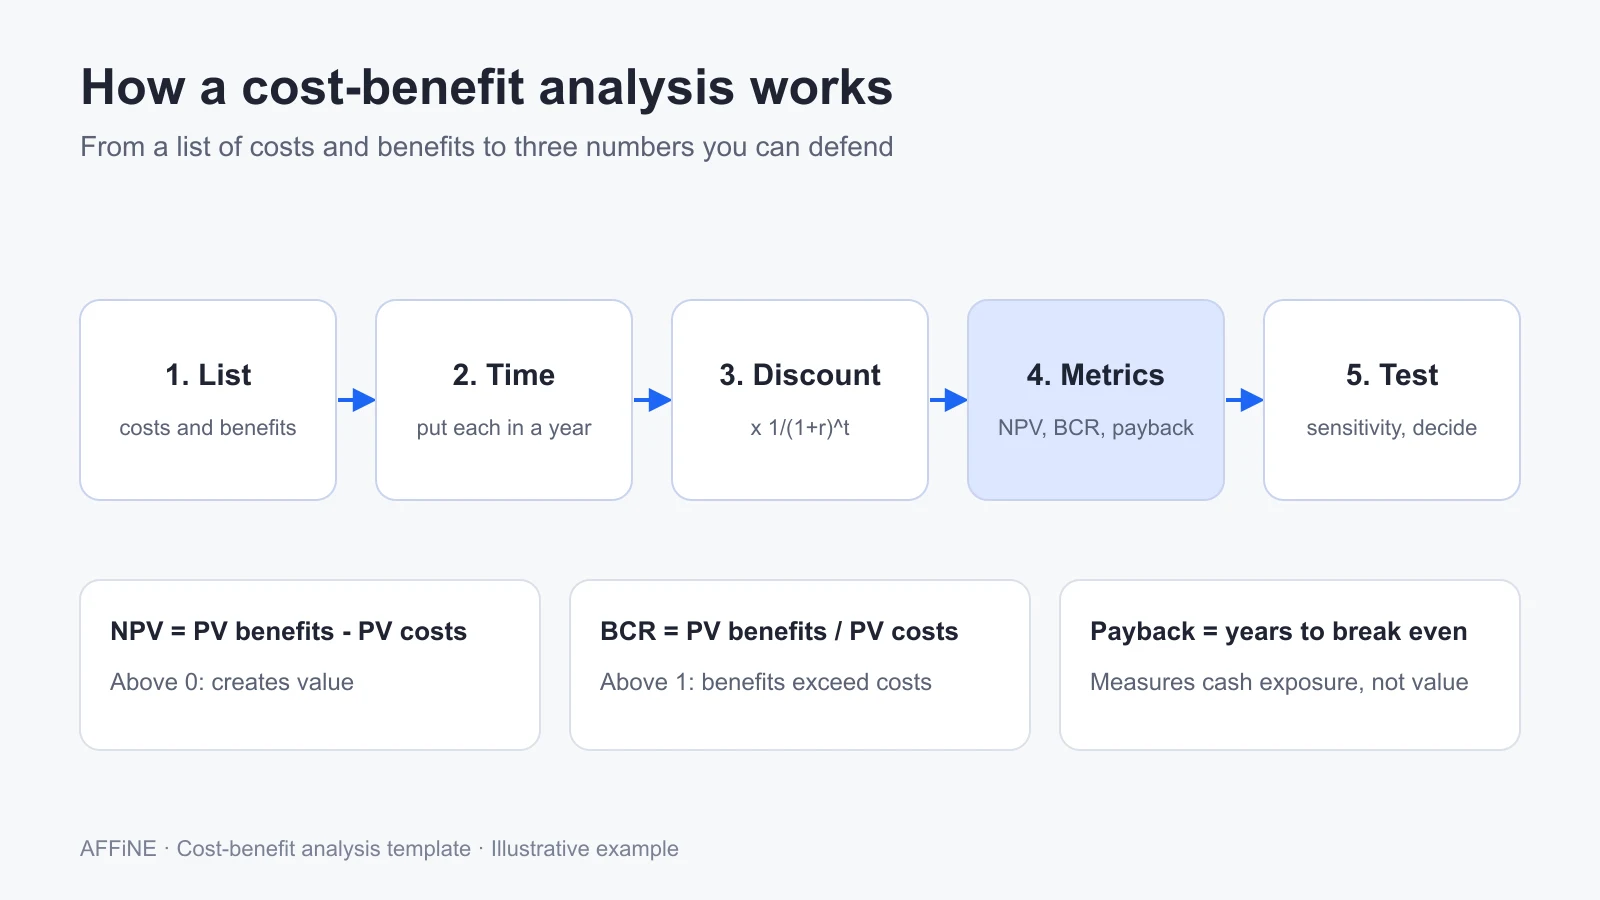
A cost-benefit analysis (CBA) lists every cost and every benefit of a decision, puts them in the same currency and the same years, and asks one question: do the benefits outweigh the costs, and by how much? This page gives you a free cost-benefit analysis template you can copy, the three formulas most teams need (net present value, benefit-cost ratio, and payback period), and a fully worked example with every number shown.
Short version
- Use the template when a decision has real costs and benefits spread over more than one year: a software purchase, a new hire, a process change, or a project proposal.
- Report three numbers: net present value (NPV), benefit-cost ratio (BCR), and payback period. NPV above 0 and BCR above 1 mean the option returns more than it costs at your discount rate.
- Always add a sensitivity check. In our worked example, a 25% drop in benefits turns a clear yes (NPV $30,017) into a marginal one (NPV $1,869).
Published by AFFiNE, which makes a workspace for docs, tables, and whiteboards. The formulas in this article were checked against official guidance on October 28, 2026, and the example arithmetic was verified with a script. Sources are listed at the end.
What a cost-benefit analysis is, and what it is not
A cost-benefit analysis compares the total expected benefits of an option with its total expected costs, after converting both into money and adjusting for when they happen. Harvard Business School Online describes the core idea simply: tally the costs, subtract them from the projected benefits, and sometimes express the result as a ratio. Governments use the same method at a much larger scale. The UK Treasury's Green Book and the US Office of Management and Budget both publish detailed CBA guidance for public spending.
A cost-benefit analysis is not:
- A budget. A budget plans spending. A CBA asks whether the spending is worth it.
- A business case. A business case is a broader document that also covers strategy, options, delivery, and funding. A CBA is usually the economic section inside it.
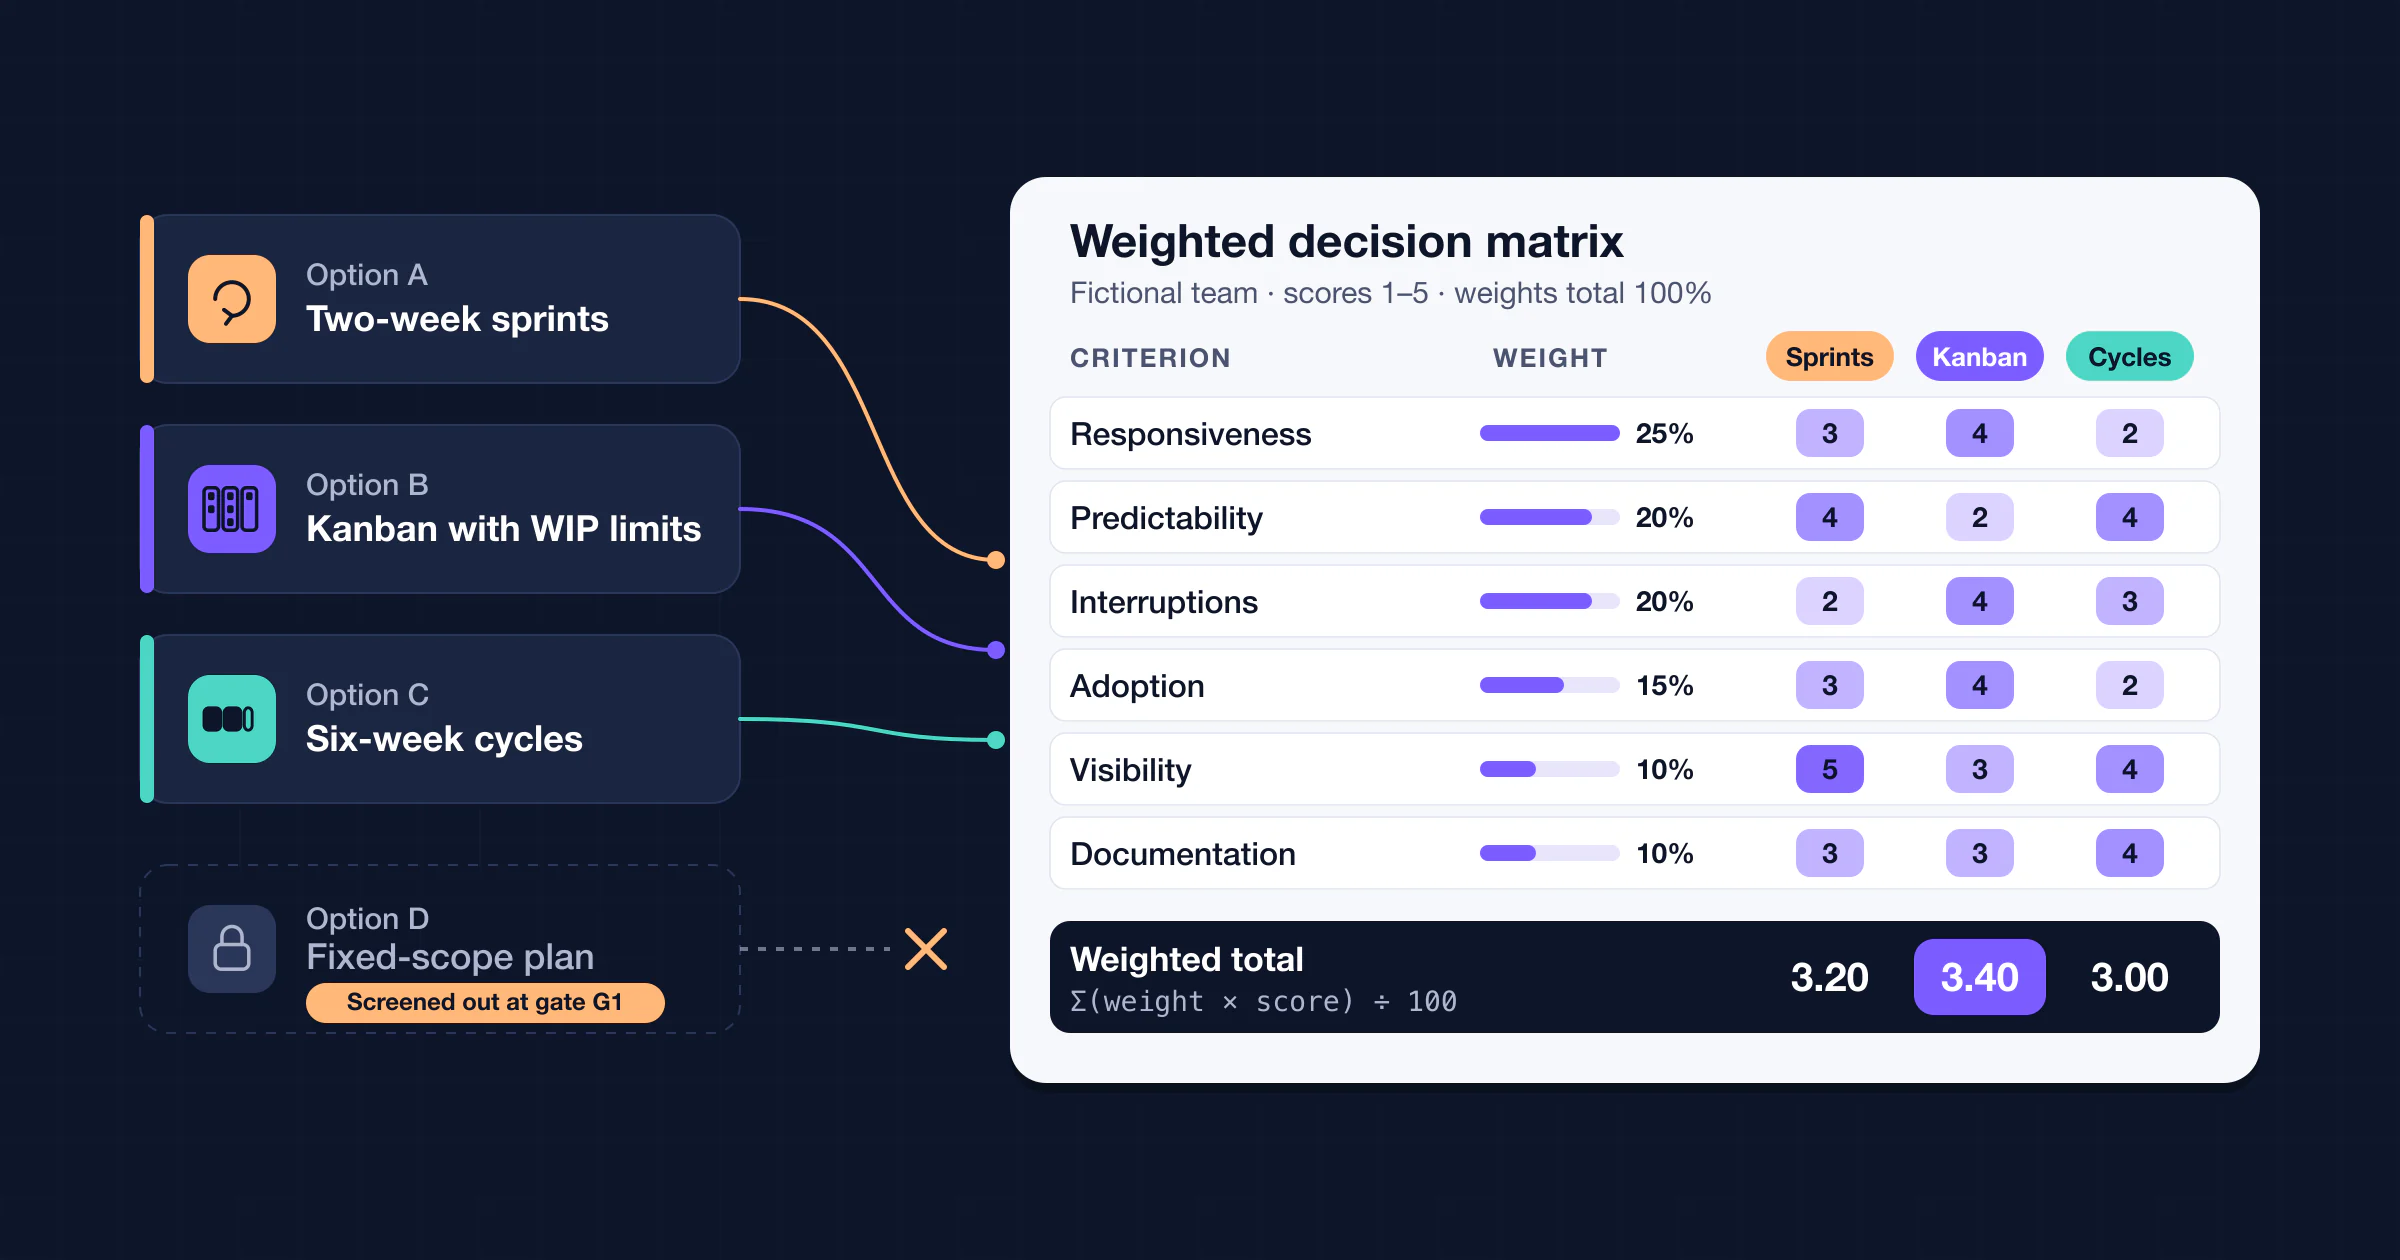
- A decision matrix. A decision matrix scores options against weighted criteria, many of them non-financial. A CBA turns everything it can into money. Teams often use both: the CBA for the financial view, the matrix for everything else.
What goes in a cost-benefit analysis template
A useful template has more than two columns of pros and cons. These are the parts that make the result checkable:
| Section | What it holds | Why it matters |
|---|---|---|
| Decision and options | The question, the options (including "do nothing"), time horizon, discount rate | Every option is measured on the same basis |
| Costs table | One-time and recurring costs by year, with a source for each | Hidden costs, such as staff time, show up |
| Benefits table | Tangible benefits by year, plus intangible ones listed separately | Benefits are tied to a number someone owns |
| Net cash flow table | Benefits minus costs per year, discount factors, present values | The time value of money is visible, not buried in a formula |
| Summary metrics | NPV, benefit-cost ratio, payback, discounted payback | Reviewers get the answer in one table |
| Assumptions | Each input, its owner, and a confidence level | A reviewer can challenge one number at a time |
| Sensitivity and risks | Low and high cases, break-even point, intangibles | Shows how fragile the answer is |
| Recommendation | Go, no go, or go with conditions, plus sign-off | The analysis ends in a decision |
The three formulas you need
Net present value (NPV)
Money received later is worth less than money received today, because today's money could be invested or used to pay down debt. NPV converts every year's net cash flow into today's money and adds them up:
NPV = sum over years t of (benefits in year t - costs in year t) / (1 + r)^t
Here, r is the discount rate per year and t is the year, with Year 0 being today. A positive NPV means the option creates more value than it costs at that discount rate.
One spreadsheet trap: Excel's NPV function assumes the first value happens one period from now. Microsoft's documentation says that if your first cash flow happens at the start of the first period, you must add it outside the function. So for an upfront cost in Year 0, use =NPV(rate, Year1:Year3) + Year0, not =NPV(rate, Year0:Year3).
Benefit-cost ratio (BCR)
OMB Circular A-94 defines the benefit-cost ratio as the ratio between the discounted present value of benefits and the discounted present value of costs:
BCR = present value of benefits / present value of costs
A BCR above 1 means benefits exceed costs. It is useful for comparing options of different sizes, but it can mislead: whether you record an item as a cost or as a negative benefit changes the ratio, while NPV stays the same. Use NPV to decide and BCR to communicate.
Payback period
The payback period is the time it takes for cumulative net cash flow to reach zero. It ignores the discount rate and anything that happens after payback, so it measures risk and cash exposure rather than value. The discounted payback period does the same calculation with present values, which makes it a little longer and more honest.
If payback falls partway through a year, interpolate: years before payback + (amount still unrecovered at the start of the year / net cash flow in that year).
Cost-benefit analysis example: a support automation tool
Here is a complete example. A 40-person customer support team is considering a help desk automation tool that suggests answers and closes simple tickets. The decision is whether to buy it for three years. Finance asks teams to use an 8% annual discount rate. All numbers are illustrative but realistic for a team this size; replace them with your own quotes and estimates.
Step 1: costs
| Cost item | Type | Year 0 | Year 1 | Year 2 | Year 3 |
|---|---|---|---|---|---|
| Vendor setup and configuration | One-time | $18,000 | |||
| Data migration | One-time | $6,000 | |||
| Training: 40 agents x 5 hours x $30 | One-time | $6,000 | |||
| Licenses: 40 seats x $25 x 12 months | Recurring | $12,000 | $12,000 | $12,000 | |
| Admin time: 0.1 FTE | Recurring | $8,400 | $8,400 | $8,400 | |
| Total costs | $30,000 | $20,400 | $20,400 | $20,400 |
Step 2: benefits
The support lead estimates 1,200 agent hours saved in Year 1 while the tool is tuned, then 1,600 hours a year once it is fully adopted. At a loaded cost of $30 per hour, that is $36,000 in Year 1 and $48,000 in Years 2 and 3. Faster first responses and better customer satisfaction are real benefits too, but they are listed as intangibles rather than given a made-up price.
Step 3: net cash flow and present value
| Year | Benefits | Costs | Net cash flow | Discount factor at 8% | Present value | Cumulative net | Cumulative present value |
|---|---|---|---|---|---|---|---|
| 0 | $0 | $30,000 | -$30,000 | 1.0000 | -$30,000 | -$30,000 | -$30,000 |
| 1 | $36,000 | $20,400 | $15,600 | 0.9259 | $14,444 | -$14,400 | -$15,556 |
| 2 | $48,000 | $20,400 | $27,600 | 0.8573 | $23,663 | $13,200 | $8,107 |
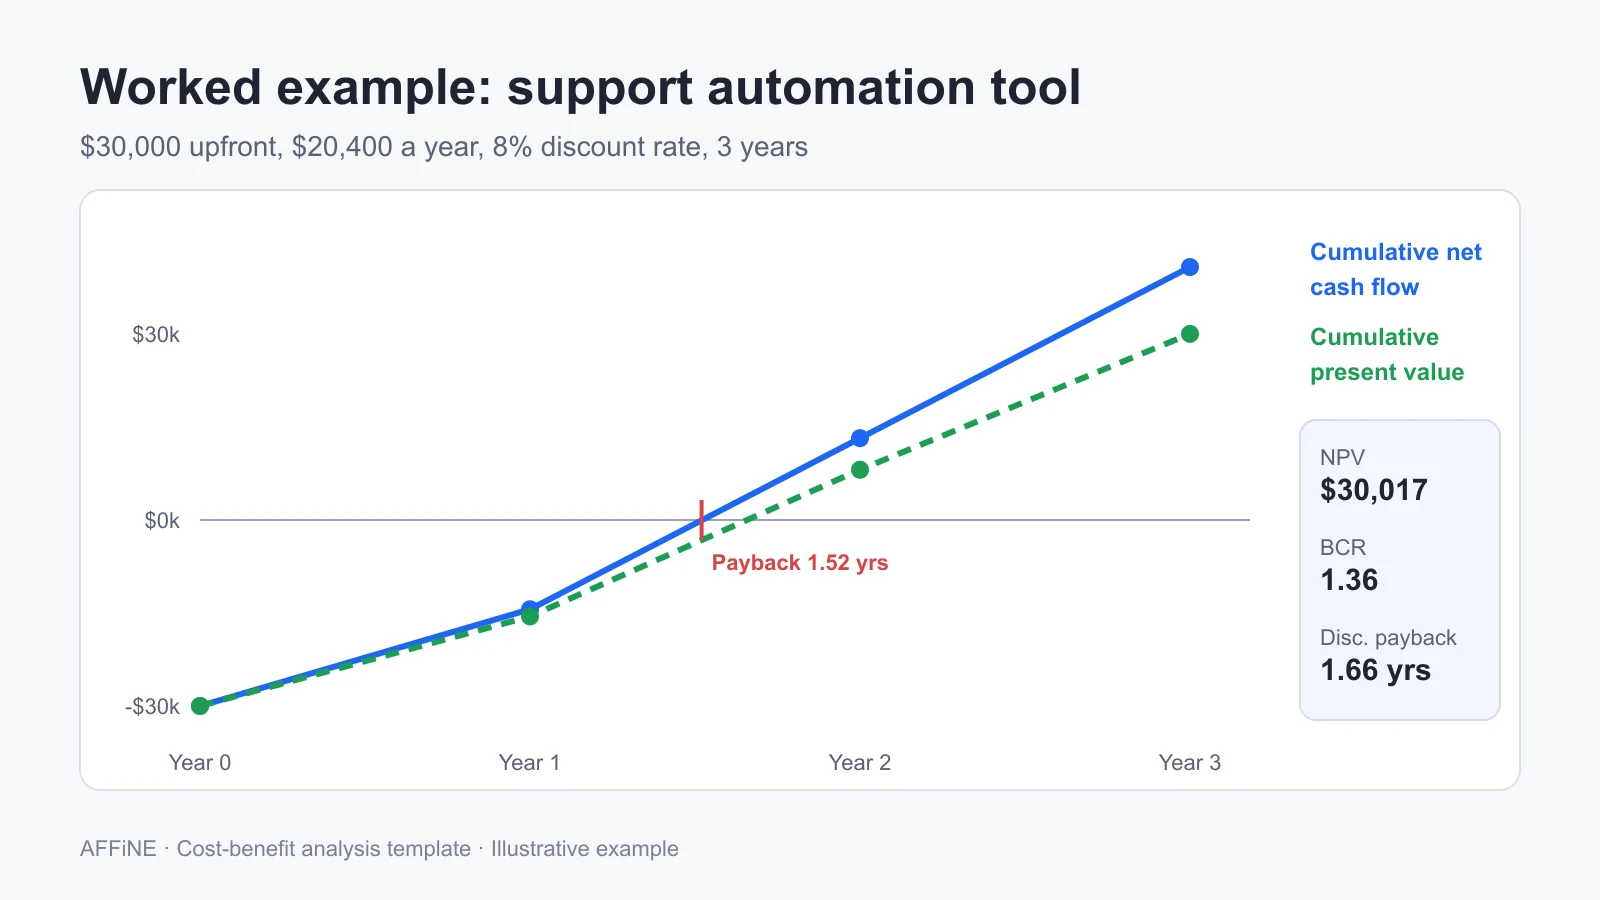
| 3 | $48,000 | $20,400 | $27,600 | 0.7938 | $21,910 | $40,800 | $30,017 |
Step 4: summary metrics
| Metric | Calculation | Result |
|---|---|---|
| Present value of benefits | $33,333 + $41,152 + $38,104 | $112,590 |
| Present value of costs | $30,000 + $18,889 + $17,490 + $16,194 | $82,573 |
| Net present value | $112,590 - $82,573 | $30,017 |
| Benefit-cost ratio | $112,590 / $82,573 | 1.36 |
| Payback period | 1 + $14,400 / $27,600 | 1.52 years |
| Discounted payback period | 1 + $15,556 / $23,663 | 1.66 years |
The tool returns about $1.36 in present value for every $1 it costs, and pays back in roughly a year and a half. On these numbers it is a yes.
Step 5: sensitivity check
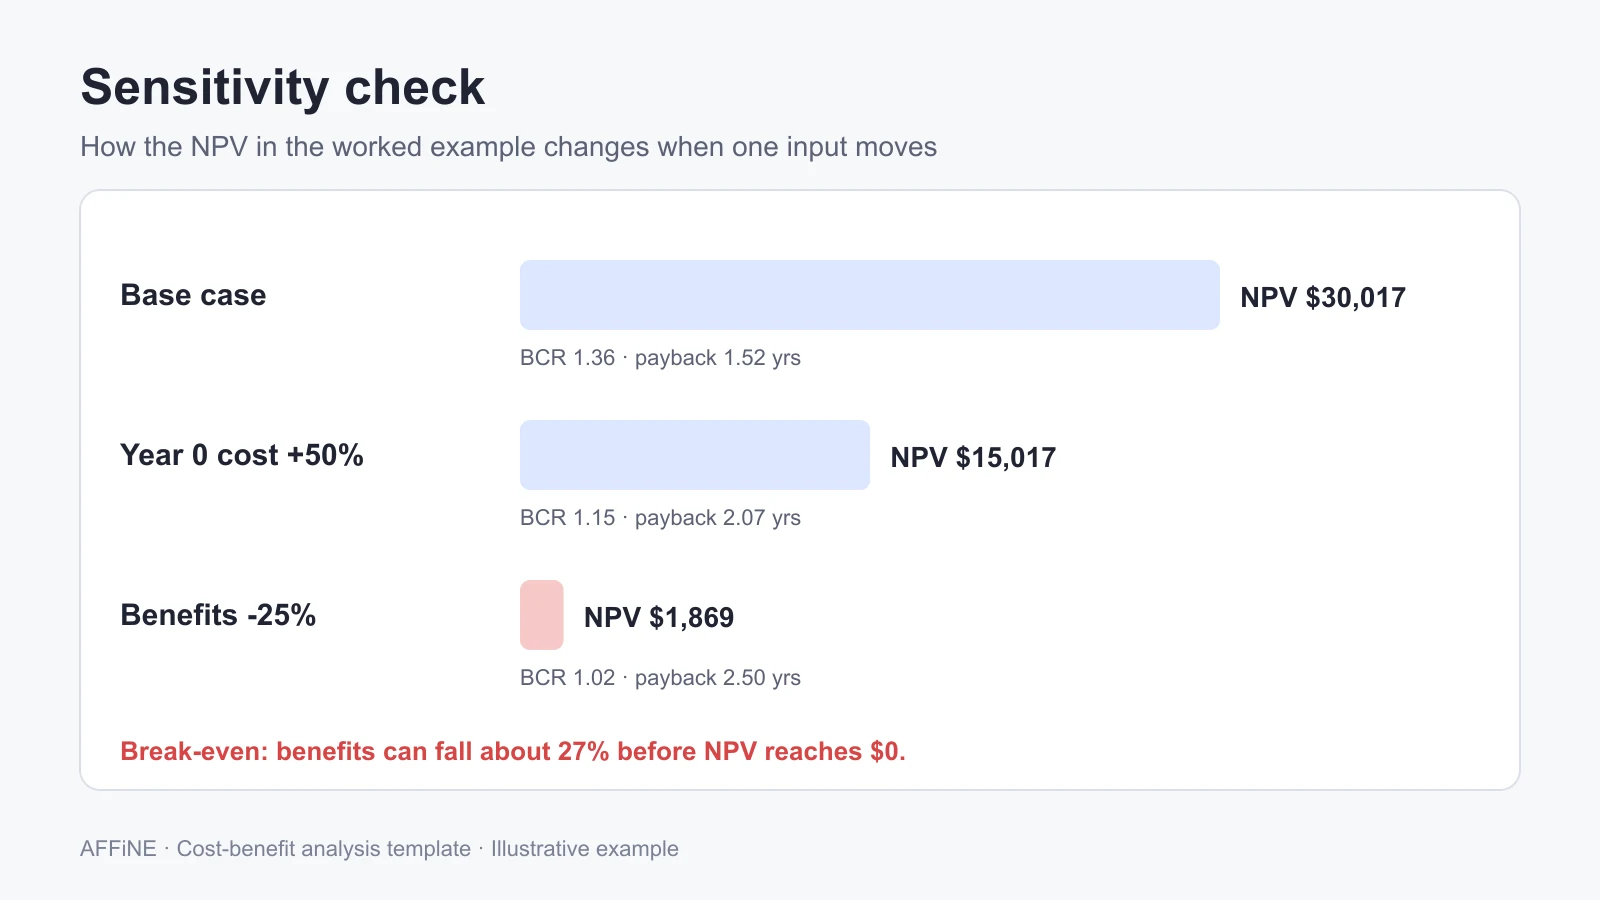
The hours-saved estimate is the weakest input, so test it first:
| Scenario | What changes | NPV | BCR | Payback |
|---|---|---|---|---|
| Base case | As above | $30,017 | 1.36 | 1.52 years |
| Low benefits | Benefits 25% lower in every year | $1,869 | 1.02 | 2.50 years |
| Higher setup cost | Year 0 cost 50% higher ($45,000) | $15,017 | 1.15 | 2.07 years |
The break-even point is useful to say out loud: benefits can fall about 27% below the estimate before NPV reaches zero ($82,573 / $112,590 = 0.733). So the decision really depends on one question for the support lead: how confident are you in 1,600 saved hours a year? A sensible outcome here is "go with conditions": buy, and review actual hours saved after six months.
How to do a cost-benefit analysis in 7 steps
1. Define the decision and the options
Write the decision as one question and list at least two options, including doing nothing. Set the time horizon and the discount rate before you collect any numbers, so they cannot be tuned to get the answer you want.
2. List every cost by year
Include one-time costs, recurring costs, and people time such as training, administration, and migration. Put each cost in the year it happens and note where the number came from.
3. List every benefit by year
Write down revenue gains, cost savings, and time saved, each with an owner who can defend the estimate. List benefits you cannot price, such as morale or brand, in a separate intangibles list instead of inventing a number.
4. Put costs and benefits in the same currency
Convert hours, units, and percentages into money with a stated rate, for example a loaded hourly cost. Use one price basis for every row, either today's prices or nominal prices, and do not mix them.
5. Discount future values and calculate the metrics
Multiply each year's net cash flow by 1/(1+r)^t to get its present value. Add them up for NPV, divide the present value of benefits by the present value of costs for the benefit-cost ratio, and find the year when cumulative net cash flow reaches zero for payback.
6. Run a sensitivity check
Change the weakest assumption, usually the size of the benefit, and recalculate. Find the break-even point where NPV reaches zero and compare it with how confident the owner is in the estimate.
7. Write the recommendation and record the decision
State go, no go, or go with conditions, the main reason, and the biggest risk. Keep the analysis with the decision record so you can compare estimates with actual results later.
Use the template
Prefer a ready-made page? Open the cost-benefit analysis template in AFFiNE and click "Use this template" to copy it into your workspace.
Copy the Markdown below into any editor that understands Markdown, including an AFFiNE doc, Notion, or a GitHub issue. Headings, tables, and checkboxes come through as structure. The example rows match the worked example above; replace them with your own.
# Cost-Benefit Analysis

**Decision:** [What are we deciding? One sentence.]
**Owner:** [Name] | **Date:** [YYYY-MM-DD] | **Status:** Draft / In review / Decided

> How to use this page: fill in sections 1 to 4 first, then calculate the summary metrics in section 5. Keep every assumption in section 6 so a reviewer can change one number and see what moves.

## 1. Decision and options

- **Problem or opportunity:** [What happens if we do nothing?]
- **Option A (proposed):** [Short description]
- **Option B (alternative):** [Short description, or "Do nothing"]
- **Time horizon:** [e.g. 3 years]
- **Discount rate:** [e.g. 8% per year, from finance]
- **Currency and price basis:** [e.g. USD, today's prices]

## 2. Costs

| Cost item | Type | Year 0 | Year 1 | Year 2 | Year 3 | Source or assumption |
| --- | --- | --- | --- | --- | --- | --- |
| Vendor setup and configuration | One-time | 18,000 | 0 | 0 | 0 | Vendor quote, Oct 2026 |
| Software licenses (40 seats) | Recurring | 0 | 12,000 | 12,000 | 12,000 | 40 x $25 x 12 months |
| Admin time (0.1 FTE) | Recurring | 0 | 8,400 | 8,400 | 8,400 | Ops manager estimate |
| [Add row] | | | | | | |
| **Total costs** | | | | | | |

## 3. Benefits

| Benefit item | Type | Year 0 | Year 1 | Year 2 | Year 3 | Source or assumption |
| --- | --- | --- | --- | --- | --- | --- |
| Agent hours saved | Tangible | 0 | 36,000 | 48,000 | 48,000 | 1,200 h then 1,600 h x $30 loaded cost |
| Faster first response | Intangible | - | - | - | - | Not monetized; see section 7 |
| [Add row] | | | | | | |
| **Total benefits** | | | | | | |

## 4. Net cash flow by year

| Year | Total benefits | Total costs | Net cash flow | Discount factor 1/(1+r)^t | Present value | Cumulative net |
| --- | --- | --- | --- | --- | --- | --- |
| 0 | | | | 1.0000 | | |
| 1 | | | | | | |
| 2 | | | | | | |
| 3 | | | | | | |

## 5. Summary metrics

| Metric | Formula | Result |
| --- | --- | --- |
| Present value of benefits (PVB) | Sum of benefits x discount factor | |
| Present value of costs (PVC) | Sum of costs x discount factor | |
| Net present value (NPV) | PVB - PVC | |
| Benefit-cost ratio (BCR) | PVB / PVC | |
| Payback period | Years until cumulative net cash flow reaches 0 | |
| Discounted payback period | Years until cumulative present value reaches 0 | |

> Rule of thumb: NPV above 0 and BCR above 1 mean the option pays back more than it costs at your discount rate. They are a signal for discussion, not an automatic yes.

## 6. Assumptions

| Assumption | Value | Owner | Confidence (High / Medium / Low) |
| --- | --- | --- | --- |
| Loaded hourly cost of an agent | $30 | Finance | High |
| Hours saved in Year 1 | 1,200 | Support lead | Medium |
| Hours saved from Year 2 | 1,600 | Support lead | Low |

## 7. Sensitivity and risks

| Scenario | What changes | NPV | BCR | Payback |
| --- | --- | --- | --- | --- |
| Base case | Assumptions as above | | | |
| Low benefits | Benefits 25% lower | | | |
| Higher setup cost | Year 0 cost 50% higher | | | |

- **Break-even point:** [How far can benefits fall before NPV reaches 0?]
- **Intangible benefits and costs:** [List what you could not price, and why it matters]
- **Main risks:** [Adoption, delivery delay, price increase]

## 8. Recommendation and sign-off

- [ ] Every cost and benefit has a source or a named owner
- [ ] Costs include one-time, recurring, and people time
- [ ] The same discount rate and horizon apply to every option
- [ ] Sensitivity cases are filled in
- [ ] Intangibles are listed, not hidden

**Recommendation:** [Go / No go / Go with conditions]
**Reason in one paragraph:** [Why, including the main risk]
**Approved by:** [Name, date]
If you prefer a spreadsheet, the same layout works: one row per cost or benefit, one column per year, and the summary metrics at the bottom. Keep the assumptions table next to the numbers, not in a separate file.
How to choose a discount rate
The discount rate is the most argued-about input, and it changes the answer. A few practical rules:
- In a company, ask finance. Most finance teams have a standard rate, often called a hurdle rate or cost of capital, for internal investment decisions. Use it for every option so comparisons are fair.
- In the public sector, use the published rate. The UK Green Book sets a social time preference rate of 3.5% in real terms for the first 30 years of most appraisals. HM Treasury's 2026 discount rate review recommended lowering the headline rate to 3%, but until the Treasury publishes updated guidance, the 3.5% rate still applies. US federal agencies follow OMB Circular A-94: in 2025, OMB memo M-25-23 rescinded the November 2023 revision and reinstated the 1992 circular, whose base case uses a 7% real discount rate. Check the current version before you start.
- Match the rate to the price basis. A real discount rate goes with today's prices; a nominal rate goes with prices that include inflation.
- Short horizons matter less. Over three years, moving from 8% to 5% changes the example NPV by a few thousand dollars. Over twenty years, the rate can decide the outcome.
Common mistakes and honest limits
- Leaving out people time. Training, admin, and migration are often larger than the license fee.
- Counting a benefit twice. If saved hours are counted as savings, do not also count the extra tickets those hours could handle.
- Treating estimates as facts. A benefit with no owner and no source is a guess. Mark its confidence.
- Ignoring "do nothing". The real comparison is against what happens if you do not act, which is rarely zero cost.
- Hiding intangibles. Unpriced items should be listed and discussed, not dropped.
- Over-trusting the ratio. A BCR of 3.0 on a tiny pilot may be worth less than a BCR of 1.3 on a large rollout. Look at NPV too.
A cost-benefit analysis is only as good as its estimates, and long-range forecasts are the least reliable part. It also does not tell you who pays and who benefits, which can matter as much as the total. Use it to structure a decision and expose assumptions, not to replace judgment.
Cost-benefit analysis vs ROI, business case, and decision matrix
| Tool | Answers | Handles time value of money | Best for |
|---|---|---|---|
| Cost-benefit analysis | Do benefits outweigh costs, and by how much? | Yes, through discounting | Investment and policy decisions over several years |
| ROI | What percentage return does the money earn? | Usually not | Quick comparisons of short projects |
| Business case | Should we do this, and how? | Contains a CBA | Funding approval with strategy, delivery, and risk |
| Decision matrix | Which option scores best on weighted criteria? | No | Choices driven by non-financial criteria |
For the example above, simple undiscounted ROI is ($132,000 - $91,200) / $91,200 = 44.7%. It looks good, but it says nothing about when the money comes back, which is why the template reports NPV and payback instead. If you plan a project after approval, a project charter template is the natural next document. If the analysis has to sit inside a full funding request, our business case template shows where it fits alongside strategy, risks, and delivery.
FAQ
What should a cost-benefit analysis template include?
It should include the decision and options, a costs table and a benefits table by year, a net cash flow table with discount factors, summary metrics (NPV, benefit-cost ratio, and payback period), an assumptions list with owners, a sensitivity check, and a recommendation with sign-off.
How do you calculate a cost-benefit analysis?
List costs and benefits by year, subtract costs from benefits for each year, and discount each year's net amount by 1/(1+r)^t. The sum is the net present value. Divide the present value of benefits by the present value of costs to get the benefit-cost ratio.
What is a good benefit-cost ratio?
Any ratio above 1 means benefits exceed costs at your discount rate. How much above 1 you need depends on risk: if the benefit estimates are uncertain, look for a ratio that stays above 1 in your low-benefit scenario.
What is a simple cost-benefit analysis example?
A support team pays $30,000 upfront and $20,400 a year for an automation tool that saves $36,000 in Year 1 and $48,000 in each of Years 2 and 3. At an 8% discount rate, the NPV is $30,017, the benefit-cost ratio is 1.36, and the payback period is about 1.5 years.
What discount rate should I use?
Use your organization's standard rate if finance has one. Public-sector analyses should use the rate published in current government guidance, such as the UK Green Book or OMB circulars in the US. Use the same rate for every option you compare.
What is the difference between a cost-benefit analysis and ROI?
ROI expresses the gain as a percentage of the cost and usually ignores when cash arrives. A cost-benefit analysis discounts future costs and benefits to today's value and reports NPV, so it handles multi-year decisions better.
Sources and editorial notes
- Microsoft Support, NPV function, for the NPV formula and the rule that a Year 0 cash flow must be added outside the function. Accessed October 28, 2026.
- US Office of Management and Budget, Circular A-94 (revised November 9, 2023), for the definition of the benefit-cost ratio as discounted benefits over discounted costs, and M-25-23, Rescission and Reinstatement of Circular No. A-94, which rescinded the 2023 revision and reinstated the October 29, 1992 circular. Accessed October 28, 2026.
- HM Treasury, Green Book supplementary guidance: discounting (February 2026) and Green Book discount rate review: findings and recommendations, for the 3.5% social time preference rate and the recommendation to move to 3%. Accessed October 28, 2026.
- Harvard Business School Online, What Is Cost-Benefit Analysis?, for the basic definition and the limits of long-range forecasts. Accessed October 28, 2026.
- US Department of Transportation, Benefit-Cost Analysis Spreadsheet Template, as an example of a public-sector template. Accessed October 28, 2026.
- SERP review of the top results for "cost-benefit analysis template", "cost benefit analysis example", and "how to do a cost-benefit analysis" (Atlassian Confluence, Asana, Smartsheet, Miro, ProjectManager, Rippling, and others) on October 28, 2026, used to find gaps rather than as factual sources.
How this guide was prepared: AFFiNE wrote this article in October 2026. The support automation example is illustrative, not a customer case or a study: the prices, hours, and discount rate were chosen to be realistic for a 40-person team, and every result in the tables was recalculated with a script before publishing. Formulas come from the official sources above. AFFiNE makes a workspace product, so we have an interest in you building templates like this one in it; the template works the same in any editor or spreadsheet. AI tools assisted with research and drafting, and the AFFiNE team reviewed and edited the content.