Pipeline Diagram: CI/CD, Data & ML Examples (2026)
A pipeline diagram shows how work moves through a fixed sequence of stages, where the output of one stage becomes the input of the next. Boxes are stages, arrows are hand-offs, and diamonds are gates where the work can stop. Engineers use pipeline diagrams to explain CI/CD (how code gets from a commit to production), data pipelines (how raw data becomes reports) and machine learning pipelines (how a model is trained, checked and released).
This guide gives you one worked example for each of those three types, the symbols to use, a step-by-step method for drawing your own, and the same diagram written as Mermaid code. The three examples are simplified and were drawn for this article. To show what a production pipeline looks like, we also map the build-and-test workflow that AFFiNE's own open-source repository runs on every pull request.
What is a pipeline diagram?
A pipeline diagram is a left-to-right (or top-to-bottom) picture of a staged process. Three things make it a pipeline rather than a general flowchart:
- Stages run in a set order. Build comes before test, ingest comes before transform.
- Each stage hands an artifact to the next. A compiled build, a raw table, a trained model.
- Gates decide whether work continues. A failed test, a data quality check or a manual approval stops the run.
Pipeline diagrams are useful when you onboard a new team member, review a change to your build or data platform, debug "where did this break?", or document a system for an audit. A good one answers three questions at a glance: what runs, in what order, and what happens when something fails.
Pipeline diagram types at a glance
The term covers several different diagrams. Pick the type that matches the process you are documenting.
| Type | What flows through it | Typical stages | Who reads it |
|---|---|---|---|
| CI/CD pipeline | Code changes | Commit, build, test, package, deploy, monitor | Developers, DevOps, release managers |
| Data pipeline (ETL / ELT) | Records and tables | Sources, ingest, store, transform, serve | Data engineers, analysts |
| Machine learning (MLOps) pipeline | Data, features, models | Collect, validate, train, evaluate, register, deploy, monitor | ML engineers, data scientists |
| CPU instruction pipeline | Machine instructions | Fetch, decode, execute, memory, write-back | Computer architecture students |
| Piping and instrumentation diagram (P&ID) | Liquids and gases | Pipes, valves, pumps, sensors | Process and plant engineers |
The first three are software pipelines and are the focus of this guide. CPU pipelines and P&IDs are covered briefly near the end.
Pipeline diagram symbols
There is no single official standard for software pipeline diagrams, so consistency matters more than any specific shape. The conventions below are common and easy to read.
| Symbol | Meaning | Example |
|---|---|---|
| Rounded rectangle | A stage or job | Build, Transform, Train |
| Cylinder | Storage | Artifact registry, data lake, warehouse |
| Diamond | Gate or decision | Tests passed? Approve release? Quality check |
| Solid arrow | Normal hand-off | Build to Test |
| Dashed or red arrow | Failure, retry or feedback path | Failed test back to the author |
| Swimlane | Environment, team or trigger | "Every pull request" vs. "main branch only" |
| Parallel branches | Jobs that run at the same time | Unit tests and linting |
Add a one-line legend to the diagram if you use color. Readers should not have to guess what red or a dashed line means.
CI/CD pipeline diagram example
A CI/CD pipeline diagram shows how a code change is built, tested and released. The example below splits the pipeline into two swimlanes: continuous integration runs on every push or pull request, while continuous delivery runs only for the main branch.
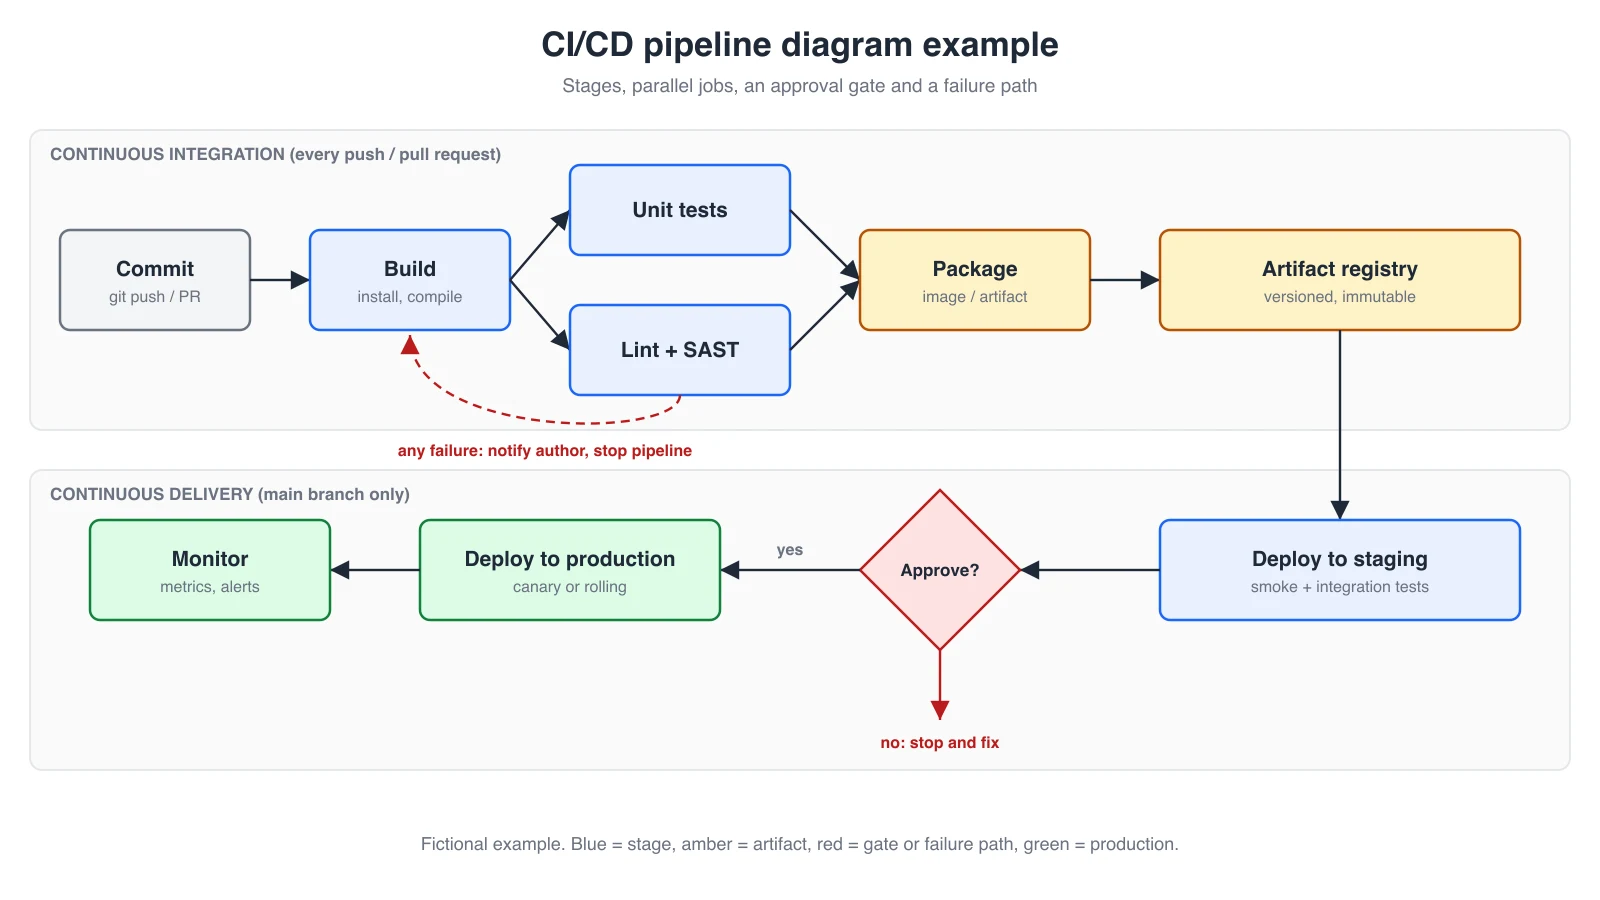
How to read it:
- Commit. A push or pull request triggers the pipeline.
- Build. Dependencies are installed and the code is compiled.
- Parallel checks. Unit tests and linting with static security analysis (SAST) run at the same time. Drawing them as parallel branches shows why the pipeline is faster than running them one by one.
- Package and store. The build becomes a versioned artifact, such as a container image, in a registry. Later stages deploy that exact artifact instead of rebuilding.
- Deploy to staging. Smoke and integration tests run in a production-like environment.
- Approval gate. A person or an automated policy decides whether to release.
- Deploy to production and monitor. A canary or rolling deployment limits the blast radius, and alerts close the loop.
The red dashed path matters as much as the happy path: any failure stops the run and notifies the author. If your diagram has no failure path, readers will assume failures are handled somewhere, which is rarely true.
Map the diagram to your CI configuration
Your diagram is most useful when every box matches something in your pipeline configuration. In GitHub Actions, each box is usually a job, and arrows come from the needs keyword. A shortened version of the example above might look like this:
name: ci-cd
on:
  push:
    branches: [main]
  pull_request:

jobs:
  build:
    runs-on: ubuntu-latest
    steps:
      - uses: actions/checkout@v4
      - run: npm ci && npm run build
  unit-tests:
    needs: build
    runs-on: ubuntu-latest
    steps:
      - uses: actions/checkout@v4
      - run: npm ci && npm test
  lint:
    needs: build
    runs-on: ubuntu-latest
    steps:
      - uses: actions/checkout@v4
      - run: npm ci && npm run lint
  deploy-staging:
    needs: [unit-tests, lint]
    if: github.ref == 'refs/heads/main'
    environment: staging
    runs-on: ubuntu-latest
    steps:
      - run: ./scripts/deploy.sh staging
  deploy-production:
    needs: deploy-staging
    environment: production
    runs-on: ubuntu-latest
    steps:
      - run: ./scripts/deploy.sh production
needs: [unit-tests, lint] is the arrow where the two parallel branches join. The approval gate is not in the YAML: in GitHub Actions it is a required reviewer configured on the production environment, which is exactly the kind of hidden step a diagram should make visible. GitHub documents this in its guide to deployment environments and required reviewers.
The same pipeline in GitLab CI
GitLab CI uses stages for the columns of your diagram and the needs keyword for arrows that skip ahead of a stage. A manual job is GitLab's version of the approval diamond:
stages: [build, test, deploy]

build:
  stage: build
  script: npm ci && npm run build

unit-tests:
  stage: test
  needs: [build]
  script: npm test

lint:
  stage: test
  needs: [build]
  script: npm run lint

deploy-production:
  stage: deploy
  needs: [unit-tests, lint]
  when: manual
  environment: production
  script: ./scripts/deploy.sh production
  rules:
    - if: $CI_COMMIT_BRANCH == $CI_DEFAULT_BRANCH
when: manual is the gate, and rules is the swimlane that limits deployment to the default branch.
Real example: AFFiNE's own build and test pipeline
Toy diagrams hide the shape real pipelines take. AFFiNE is open source, so you can check this example against the Build & Test workflow in its GitHub repository. Drawn as a pipeline diagram, it has four features that the simple example above does not:
- Fan-out, not a straight line. Lint, typecheck and CodeQL analysis start immediately and in parallel. Native builds for Linux, macOS and Windows run alongside them, and each test group waits only for the build it needs: server tests need the server native build, unit tests need the Linux native build, and desktop tests need all three platform builds plus the renderer.
- Filter jobs as gates. Small "filter" jobs check which files changed, and the Rust, iOS, Android and Copilot test jobs run only when their part of the code changed. On a diagram, each filter is a diamond with a "skip" branch, which explains why most pull requests finish faster than the full graph suggests.
- Matrix jobs as one box with a count. Desktop tests run across several operating systems and CPU architectures. Draw one box labeled "Desktop tests (OS × arch matrix)" instead of a dozen boxes.
- A single join at the end. A final job (named "3, 2, 1 Launch") depends on every other job and runs even when some fail, so branch protection can require one status check instead of dozens. On a diagram it is the one diamond every arrow converges on.
flowchart LR
  pr[Pull request] --> lint[Lint + typecheck + CodeQL]
  pr --> native[Native builds: Linux, macOS, Windows]
  pr --> server[Server native build]
  pr --> filters{Changed files?}
  native --> unit[Unit tests]
  server --> stest[Server tests and E2E]
  native --> desktop[Desktop tests: OS x arch matrix]
  filters -- Rust / mobile / Copilot --> extra[Targeted test jobs]
  filters -. no change .-> done
  lint --> done{All required jobs passed?}
  unit --> done
  stest --> done
  desktop --> done
  extra --> done
Releases are separate workflows in the same repository, which is a pattern worth copying: draw one diagram for the checks that run on every pull request and another for the release pipeline, then link them.
Data pipeline diagram example
A data pipeline diagram shows where data comes from, where it is stored, how it is transformed and who uses it. The example is an ELT pipeline: data is loaded into raw storage first and transformed afterwards.
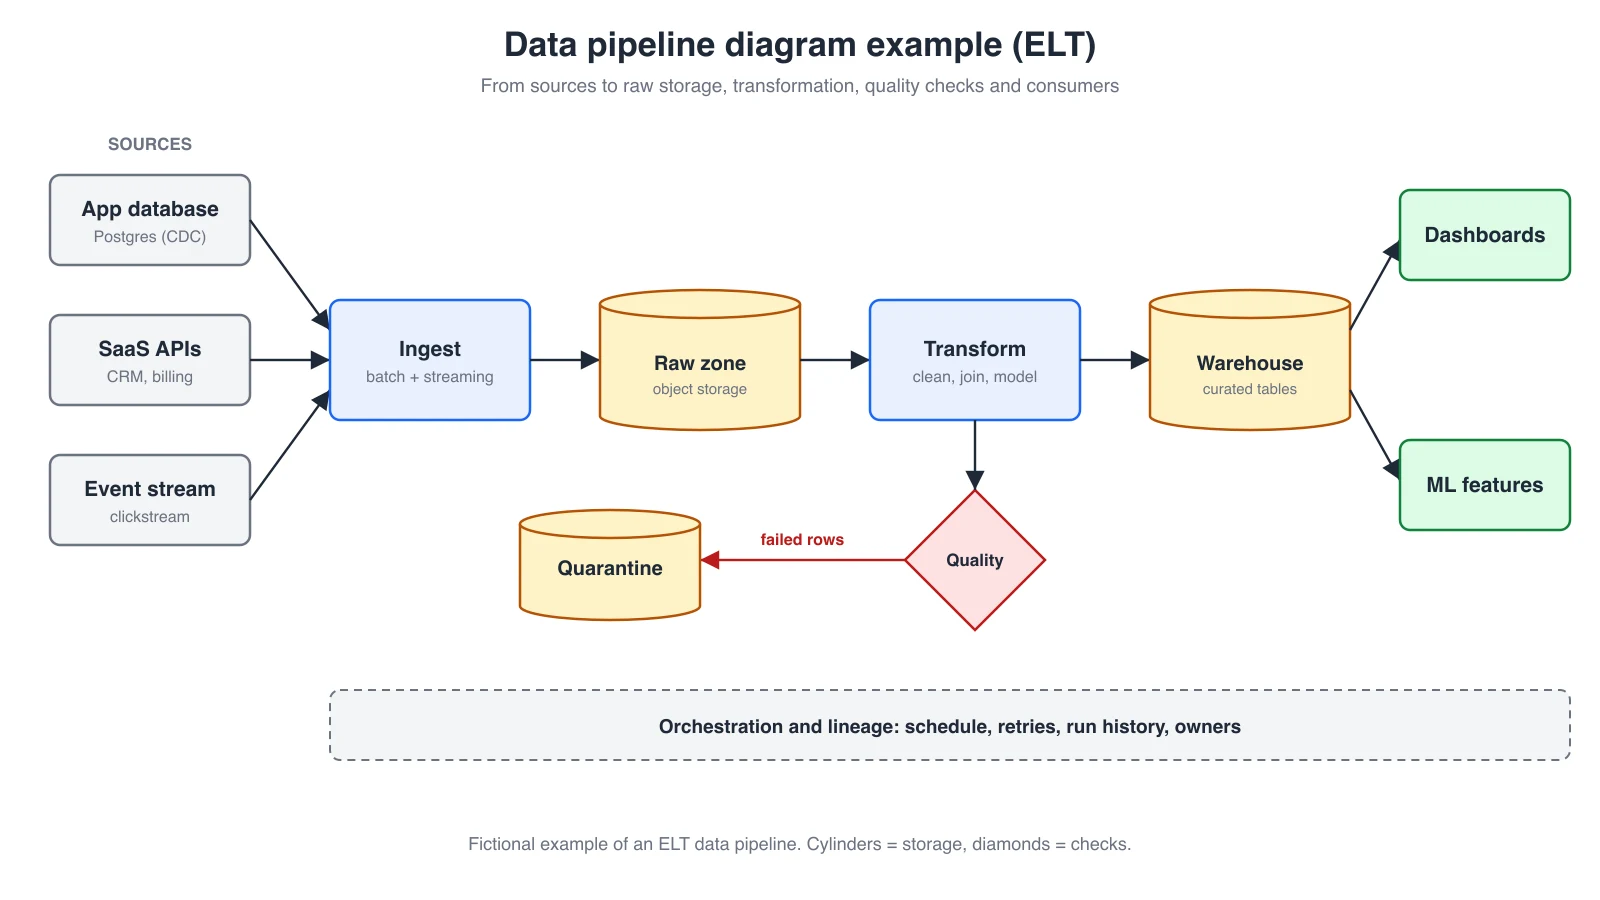
What to include in your own data pipeline diagram:
- Sources on the left, labeled with how they are read (change data capture, API pulls, event streams).
- Batch or streaming, written on the ingest stage. Readers need to know whether data is minutes or hours old.
- Storage as cylinders, so it is obvious where data rests between stages.
- Quality checks as gates, with the path bad data takes. A quarantine table is easier to debug than silently dropped rows.
- Consumers on the right, such as dashboards, reverse ETL or ML features, so people can see who is affected when a stage breaks.
- Orchestration as a band underneath, rather than drawing a line from the scheduler to every box.
ETL vs. ELT in a diagram
In ETL, the Transform box sits between the sources and the warehouse, and only cleaned data is stored. In ELT, as in the example, raw data lands first and Transform runs inside or next to the warehouse. Draw the version you actually run. Mixing the two in one diagram is a common source of confusion during incident reviews.
Data pipeline architecture patterns
Most data pipeline diagrams are a variation of one of these patterns. Name the pattern in the diagram title so readers know what to expect.
| Pattern | How data moves | How to draw it |
|---|---|---|
| Batch | Scheduled jobs process data in chunks (hourly, nightly) | One row of stages with the schedule written on the trigger, such as "daily 02:00 UTC" |
| Streaming | Events are processed continuously as they arrive | A queue or log (for example Kafka) drawn as a long horizontal pipe, with consumers branching off it |
| Change data capture (CDC) | Database changes are copied as they happen | A dashed arrow from the source database's change log, not from its tables |
| Lambda | A batch layer and a streaming layer run side by side and merge for serving | Two parallel swimlanes that join at the serving layer |
| Kappa | Everything is a stream; history is replayed from the log | One streaming lane with a "replay" loop back to the log |
| Medallion (bronze, silver, gold) | Data is refined in layers inside a lakehouse | Three storage cylinders in a row, labeled raw, cleaned and business-ready |
A pattern name is not a substitute for the details. Still mark batch or streaming on the ingest stage, show the quality gates, and list the consumers.
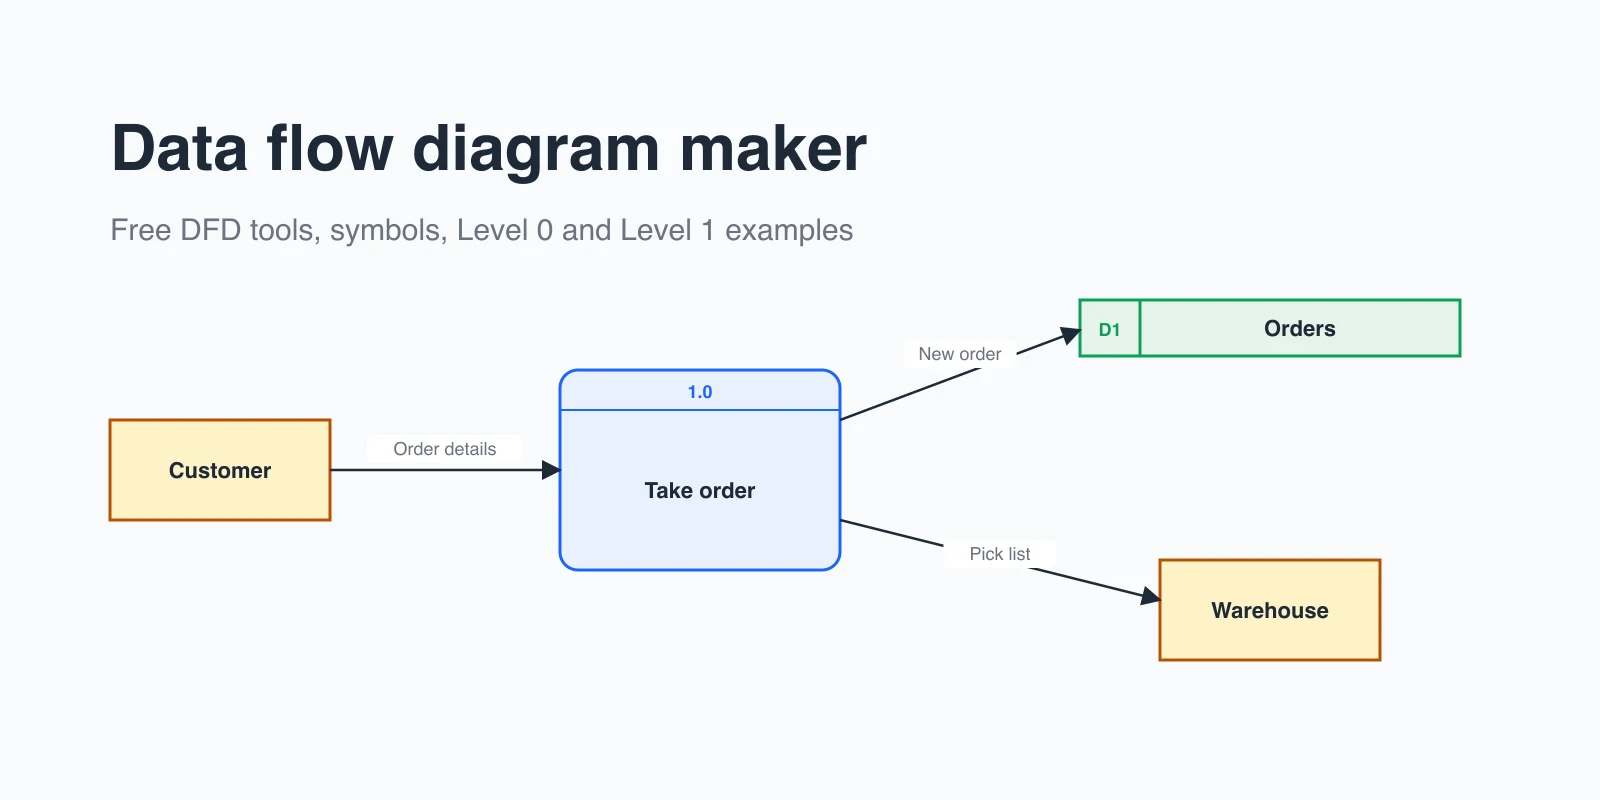
If you also need to show what data is exchanged between processes, rather than the order of stages, a data flow diagram is the better fit.
Machine learning pipeline diagram example
A machine learning pipeline diagram shows how a model goes from raw data to production and back again. The loops are what separate an MLOps pipeline from a one-off training script.
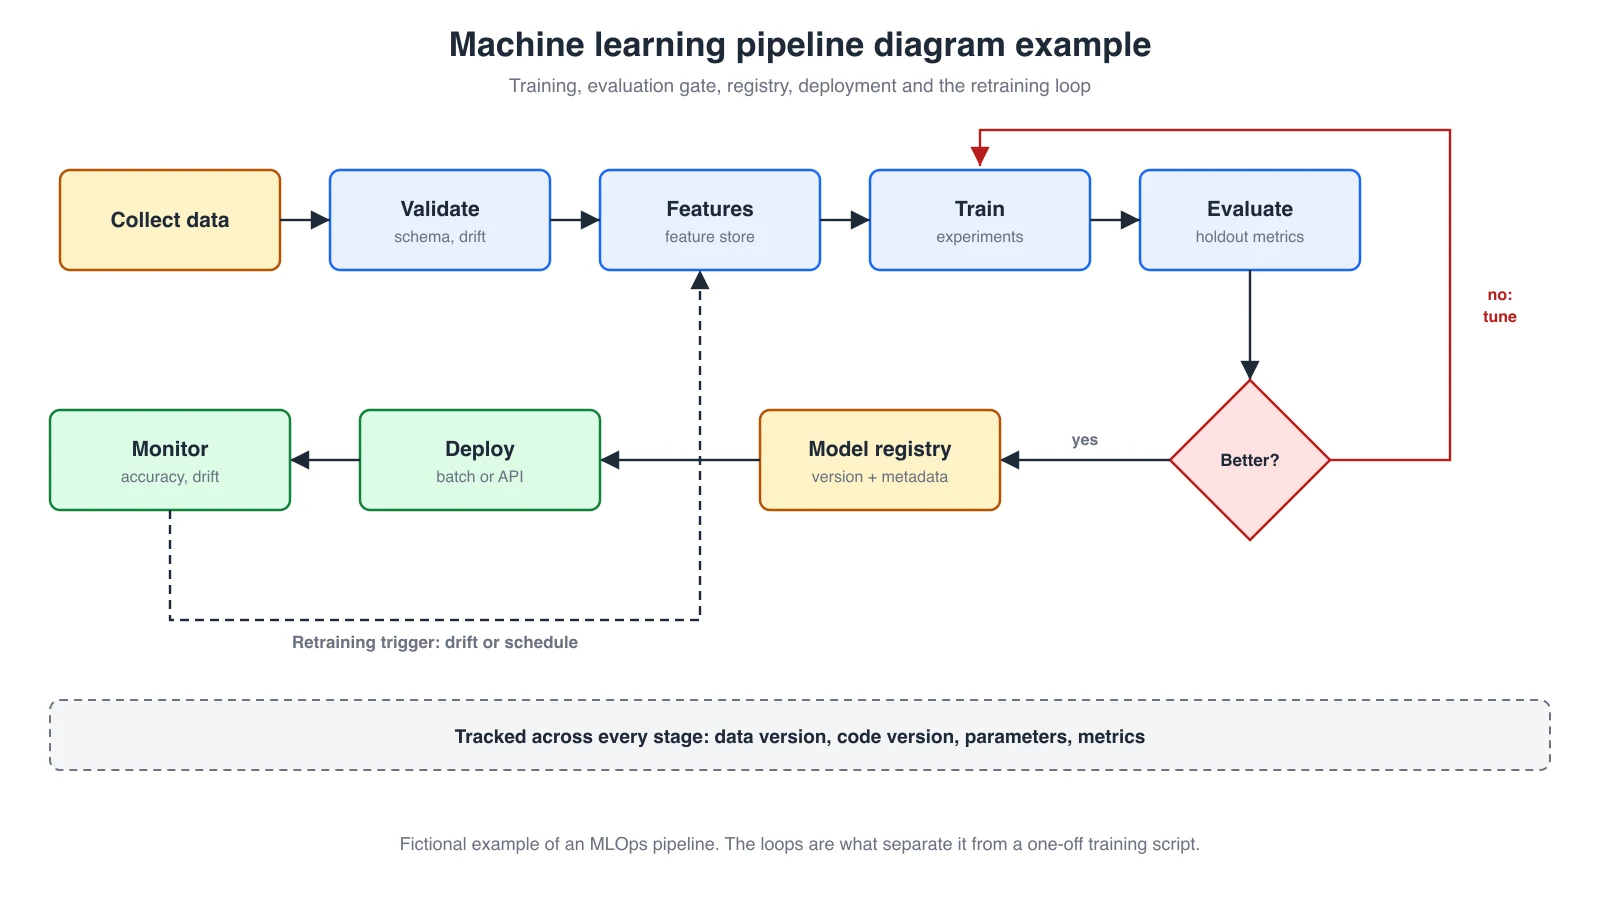
The stages in the example:
- Collect and validate data. Check the schema and compare distributions with the training data.
- Build features. Often from a shared feature store, so training and serving use the same logic.
- Train and evaluate. Compare the candidate against the current model on held-out data.
- Evaluation gate. If the candidate is not better, it goes back for tuning instead of shipping.
- Register, deploy and monitor. The registry stores the model version with its metrics, and monitoring watches for accuracy loss and drift.
- Retraining loop. Drift or a schedule starts the pipeline again.
Note the band at the bottom of the diagram: tracking data versions, code versions, parameters and metrics at every stage is what makes a result reproducible. For a retrieval-augmented generation (RAG) system, you would draw two connected pipelines: an indexing pipeline (load, chunk, embed, store vectors) and a query pipeline (embed query, retrieve, add context, generate, evaluate).
Other pipeline diagrams you may be looking for
5-stage CPU pipeline diagram
In computer architecture, a pipeline diagram shows how a processor overlaps instructions. The classic RISC pipeline has five stages: instruction fetch (IF), instruction decode (ID), execute (EX), memory access (MEM) and write-back (WB). It is usually drawn as a grid, with instructions as rows and clock cycles as columns, so you can see that while one instruction is executing, the next is being decoded and a third is being fetched. Stalls and hazards appear as empty cells or bubbles.
| Instruction | Cycle 1 | Cycle 2 | Cycle 3 | Cycle 4 | Cycle 5 | Cycle 6 | Cycle 7 |
|---|---|---|---|---|---|---|---|
| Instruction 1 | IF | ID | EX | MEM | WB | ||
| Instruction 2 | IF | ID | EX | MEM | WB | ||
| Instruction 3 | IF | ID | EX | MEM | WB |
Read the grid diagonally: in cycle 3, instruction 1 is executing, instruction 2 is being decoded and instruction 3 is being fetched. Once the pipeline is full, one instruction finishes every cycle. The three hazards that break this pattern are data hazards (an instruction needs a result that is not written yet), control hazards (a branch changes which instruction comes next) and structural hazards (two stages need the same hardware). In the grid, a hazard shows up as a bubble: the waiting instruction repeats a stage, and every instruction behind it shifts one column to the right.
Piping and instrumentation diagram (P&ID)
In process engineering, "pipeline diagram" can mean a P&ID: a detailed drawing of physical pipes, valves, pumps and instruments in a plant. These use standardized symbols, commonly based on ISA-5.1, and are drawn in specialist engineering CAD tools. If that is what you need, the software diagrams in this guide are not a substitute.
How to draw a pipeline diagram
- Pick one pipeline and one audience. "Our web app release, for new engineers" is a better scope than "all of our infrastructure".
- List the stages in order. Use the names that appear in your tools, such as job names or DAG task names.
- Mark what passes between stages. An artifact, a table or a model version.
- Find the parallel parts. Jobs that run at the same time should be drawn side by side.
- Add gates and failure paths. Every test, check and approval is a diamond with a "no" arrow.
- Group by trigger or environment. Swimlanes for "every pull request" vs. "main only", or dev, staging and production.
- Add a legend, an owner and a date. Diagrams go stale; a date tells readers how much to trust them.
- Review it against the real configuration. Walk through one recent run and check that every box and arrow happened.
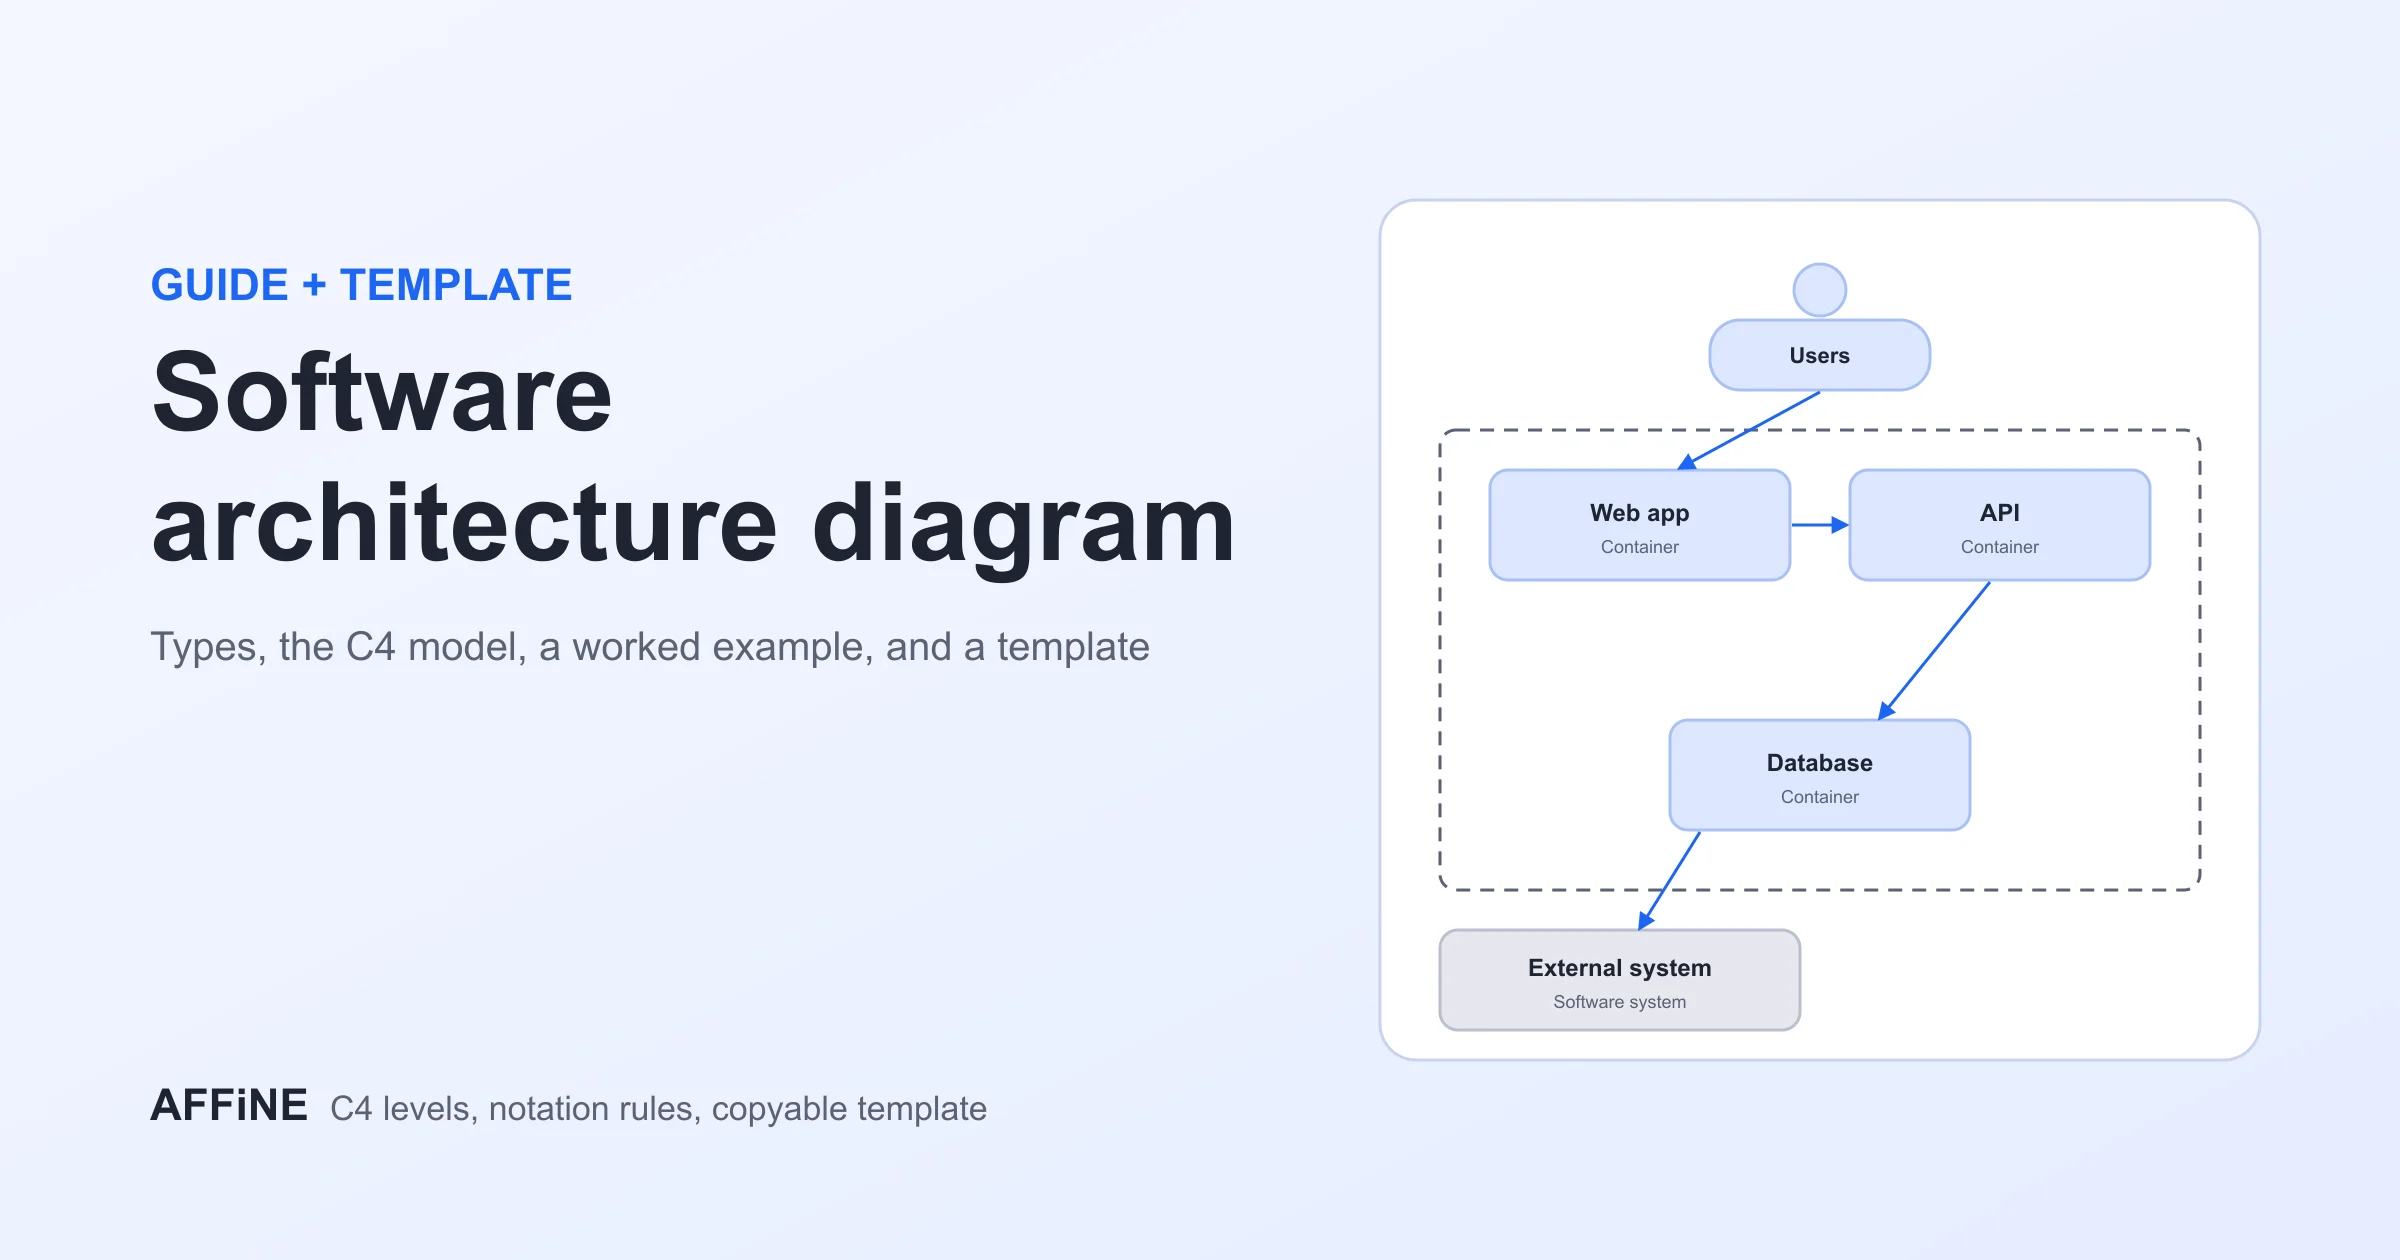
You can draw this on a whiteboard, in a diagramming tool or as code. In AFFiNE you can sketch the stages on the edgeless whiteboard canvas and keep the explanation, runbook links and open questions in the same document. The software architecture diagram guide covers how a pipeline diagram fits next to system and deployment views.
Write a pipeline diagram as code with Mermaid
If your diagram lives next to your code, writing it as text keeps it reviewable in pull requests. Mermaid flowcharts render in GitHub and GitLab Markdown and in many documentation tools. Here is the CI/CD example:
flowchart LR
  commit[Commit] --> build[Build]
  build --> unit[Unit tests]
  build --> lint[Lint + SAST]
  unit --> pkg[Package]
  lint --> pkg
  pkg --> reg[(Artifact registry)]
  reg --> staging[Deploy to staging]
  staging --> approve{Approve?}
  approve -- yes --> prod[Deploy to production]
  approve -- no --> stop[Stop and fix]
  prod --> monitor[Monitor]
  unit -. fail .-> build
flowchart LR draws left to right, [( )] draws a cylinder for storage, { } draws a diamond, and -.-> draws a dashed arrow. Use subgraphs if you want swimlanes. Code-generated diagrams are ideal for keeping docs current; a canvas is better when you need careful layout for a presentation.
Generate a first draft with AI
AI assistants are good at turning a description into a first-draft diagram, as long as you describe the real pipeline. A useful prompt names the trigger, the stages in order, what runs in parallel, the gates and the failure paths:
Draw a left-to-right pipeline diagram. Trigger: pull request to main. Build, then unit tests and lint in parallel. If both pass, package a container image to the registry, deploy to staging and run smoke tests. A manual approval gate comes before production. Any failure notifies the author. Use diamonds for gates and dashed red arrows for failures.
In AFFiNE, AFFiNE AI can turn a prompt like this into a mind map on the canvas or write the Mermaid code for you. Treat the result as a draft: check every box against your configuration, because a model cannot see which jobs your pipeline actually runs.
Common pipeline diagram mistakes
- Only drawing the happy path. Show what happens on failure, retry and rollback.
- Mixing levels of detail. One box for "Deploy" next to ten boxes for testing makes the testing look more important than it is.
- Using tool logos instead of stages. Logos change; "Build" and "Test" do not. Put the tool name in small text inside the box.
- Hiding manual steps. Approvals, sign-offs and hand-run scripts are where pipelines actually wait.
- Drawing everything in one diagram. Split CI/CD, data and ML pipelines, and link them where one feeds another.
- No date or owner. A pipeline diagram that nobody maintains becomes misleading within months.
Pipeline diagram review checklist
Before you share a pipeline diagram, check that a new reader could answer yes to each of these:
- Can I see what starts the pipeline (push, schedule, event or manual run)?
- Does every box match a job, task or step in the real configuration?
- Is every check, test and approval drawn as a gate with a failure path?
- Can I see which stages run in parallel and where they join?
- Are manual steps and steps outside the configuration file (approvals, secrets, scripts run by hand) visible?
- Does the diagram show an owner and the date it was last checked against a real run?
Pipeline diagram tools
Most general diagramming tools can draw a pipeline diagram. Choose based on where the diagram needs to live:
- Diagrams as code (Mermaid, PlantUML): best when the diagram should live in the repository and change with the pipeline.
- General diagramming apps (for example draw.io, Lucidchart, Miro): good for detailed layouts and shared editing. Check each tool's current plan limits before choosing.
- Docs plus canvas in one place (for example AFFiNE): useful when the diagram needs written context such as runbooks, decisions and owners. AFFiNE is a general workspace, not a CI/CD or data orchestration tool, so it will not read your pipeline configuration for you.
- CI and orchestration dashboards: GitHub Actions, GitLab and workflow schedulers draw a live graph of each run. Use it to check your diagram, but it rarely explains why the pipeline is shaped the way it is.
Frequently Asked Questions about Pipeline Diagrams
What is a pipeline diagram used for?
A pipeline diagram explains a staged process: what runs, in what order, what is handed between stages and what happens when a stage fails. Teams use it for onboarding, design reviews, debugging and documentation.
What are the stages of a CI/CD pipeline?
A typical CI/CD pipeline has source (commit), build, test, package or release, deploy and monitor stages. Many teams add security scanning and an approval gate before production.
What are the five stages of a CPU pipeline?
The classic RISC instruction pipeline has five stages: instruction fetch, instruction decode, execute, memory access and write-back.
How is a pipeline diagram different from a flowchart?
A pipeline diagram is a kind of flowchart focused on ordered stages that pass an artifact along. A general flowchart can show any logic, including branches that never rejoin and processes without a clear input and output.
What is a pipeline hazard?
In a CPU pipeline, a hazard is a situation that stops the next instruction from entering a stage on time. Data hazards, control hazards and structural hazards are the three types, and each one adds a bubble (a stall) to the pipeline diagram.
What is the difference between a CI/CD pipeline diagram and a DevOps pipeline diagram?
The terms are often used interchangeably. A CI/CD pipeline diagram focuses on the automated path from commit to deployment. A DevOps pipeline diagram usually widens the view to include planning, the tools at each stage, environments and the feedback from monitoring back to planning.
How do I make a pipeline diagram quickly?
List your stages in order, draw them as boxes connected by arrows, add a diamond for every check and a path for failures, then add a legend and a date. For a faster start, write it in Mermaid or begin from a template.
Start from a template
Open the free data flow diagram template, the Azure data flow template for cloud data pipelines, or the BPMN diagram template for business processes with hand-offs. For the surrounding system view, see the system context diagram guide, or browse all free diagram templates.
Update note (October 29, 2026): This article was first published in May 2025 and rewritten in October 2026 to focus on pipeline diagram examples. We replaced a long overview with three original example diagrams (CI/CD, data and machine learning), a symbol table, a GitHub Actions mapping and Mermaid code, and removed an unsupported "50% faster" claim, outdated and low-quality external links, and an empty heading. AI tools assisted with drafting, and the content was reviewed and edited by the AFFiNE team.
Update note (October 30, 2026): We added a real-world example mapped from AFFiNE's own GitHub Actions workflow, a GitLab CI version of the example, data pipeline architecture patterns, a CPU pipeline grid with hazards, a section on drafting diagrams with AI, a review checklist, two FAQs and links to the GitHub and GitLab documentation. Vincent Chen reviewed the article.