Software Architecture Diagram: Types, C4 Model, Examples, Template
Learn what a software architecture diagram is, the main diagram types, the C4 model levels, a worked container diagram example, and a free copyable template.

A software architecture diagram is a picture of how a software system is built: the people who use it, the applications and data stores inside it, the outside systems it depends on, and how they talk to each other. A good one answers one question for one audience, has a title and a legend, and labels every arrow with what flows along it and how.
This guide shows the common types of architecture diagrams, explains the C4 model that many teams use to keep them consistent, walks through a complete worked example, and ends with a copyable template you can redraw on any whiteboard.
Short version
- Start with two diagrams. A system context diagram (your system as one box, with its users and neighbors) and a container diagram (the apps, services, and databases inside it). The C4 model recommends both for every team.
- Add detail only when someone needs it. Component, deployment, sequence, and data flow diagrams answer narrower questions. Code-level diagrams are usually better generated by tools.
- Make every diagram readable on its own. Title, legend, element types, technology labels, and one-way arrows with specific labels such as "Reads and writes shifts [SQL/TLS]" instead of "Uses".
Published by AFFiNE, which makes a workspace with an Edgeless whiteboard where you can draw these diagrams. C4 model details were checked on c4model.com on October 28, 2026. Sources are listed at the end.
What is a software architecture diagram?
A software architecture diagram is a visual model of a software system's structure. It shows the major building blocks, their responsibilities, the technologies they use, and the relationships between them. Teams use architecture diagrams to onboard engineers, review designs before building, explain a system to security or operations teams, and plan changes such as splitting a monolith.
The word "architecture" covers several levels of zoom. A diagram for a product manager shows the system as a single box among its users. A diagram for a new backend engineer shows the API, the database, and the message queue. A diagram for a database reviewer shows tables. Most bad diagrams try to show all of these at once, which is why they end up as a wall of boxes nobody can read.
Types of software architecture diagrams
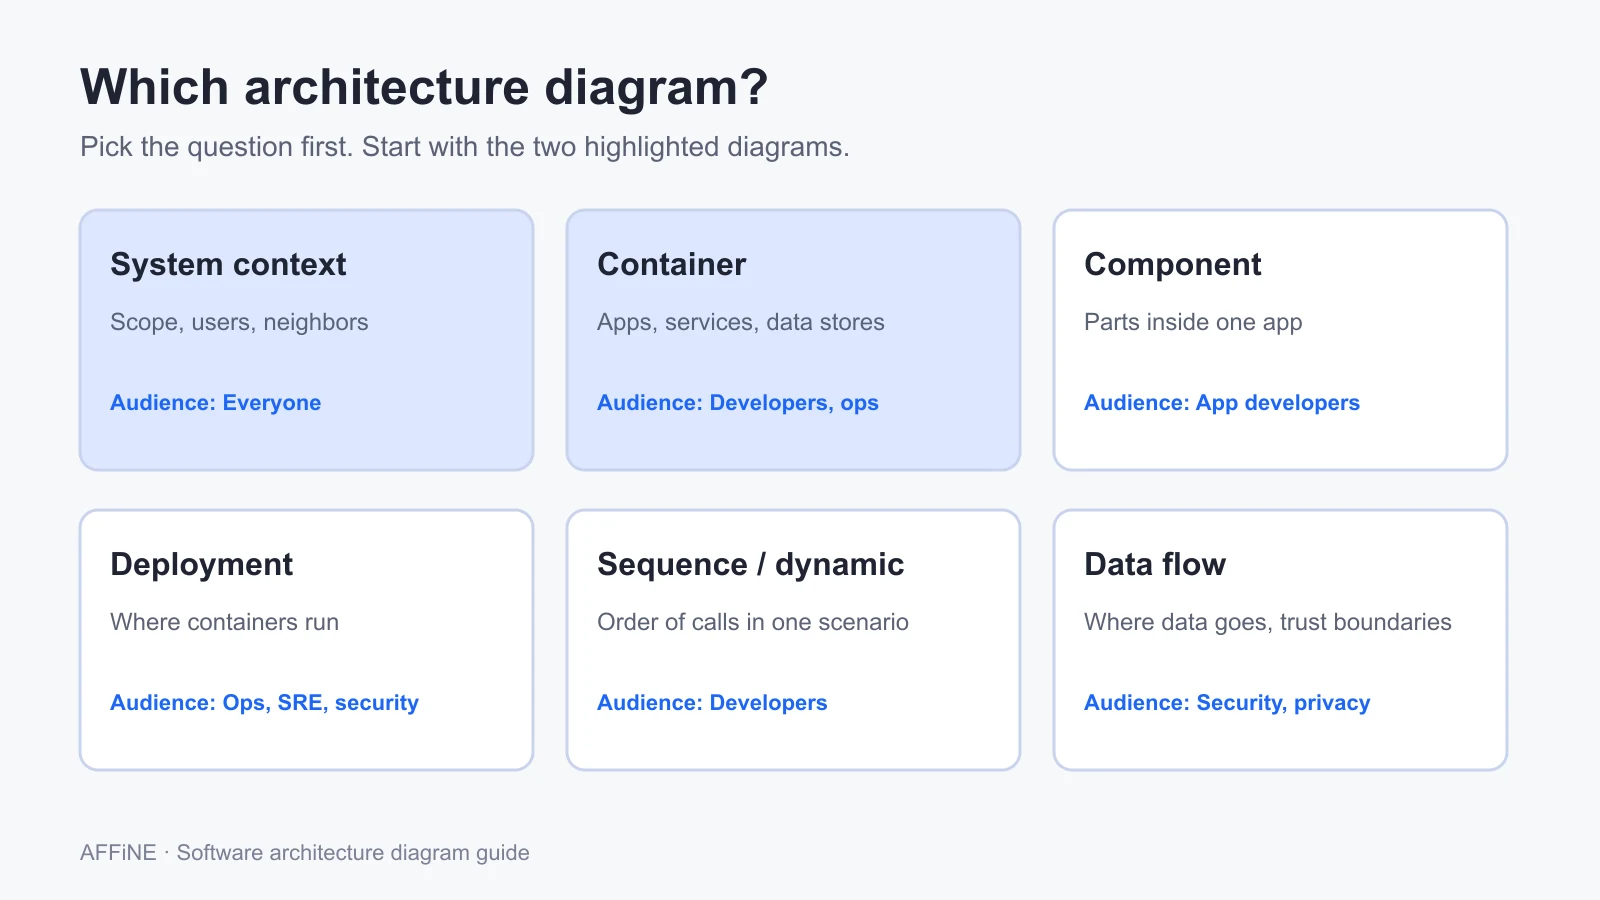
Each type answers a different question. Pick the question first, then the diagram.
| Diagram type | Question it answers | Typical audience | Level of detail |
|---|---|---|---|
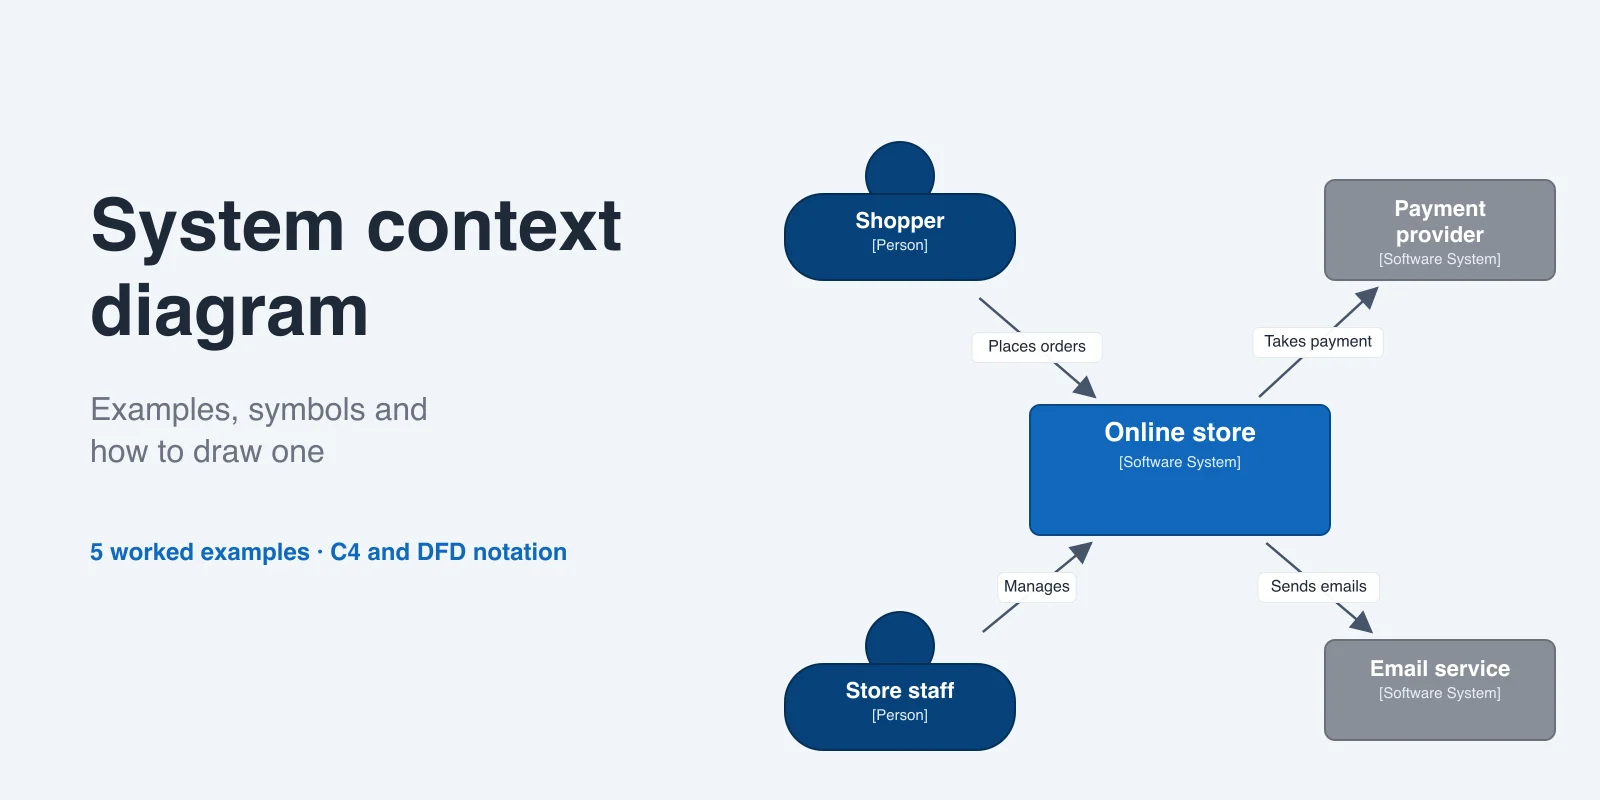
| System context | What does the system do, who uses it, and which other systems does it depend on? | Everyone, including non-technical stakeholders | Lowest: one box for the system |
| Container | Which applications and data stores make up the system, and how do they communicate? | Developers, architects, operations | Apps, services, databases, queues |
| Component | What are the main parts inside one application? | Developers working on that application | Modules or services inside one container |
| Deployment | Where does each container run in a given environment? | Operations, SRE, security | Servers, clusters, cloud services, regions |
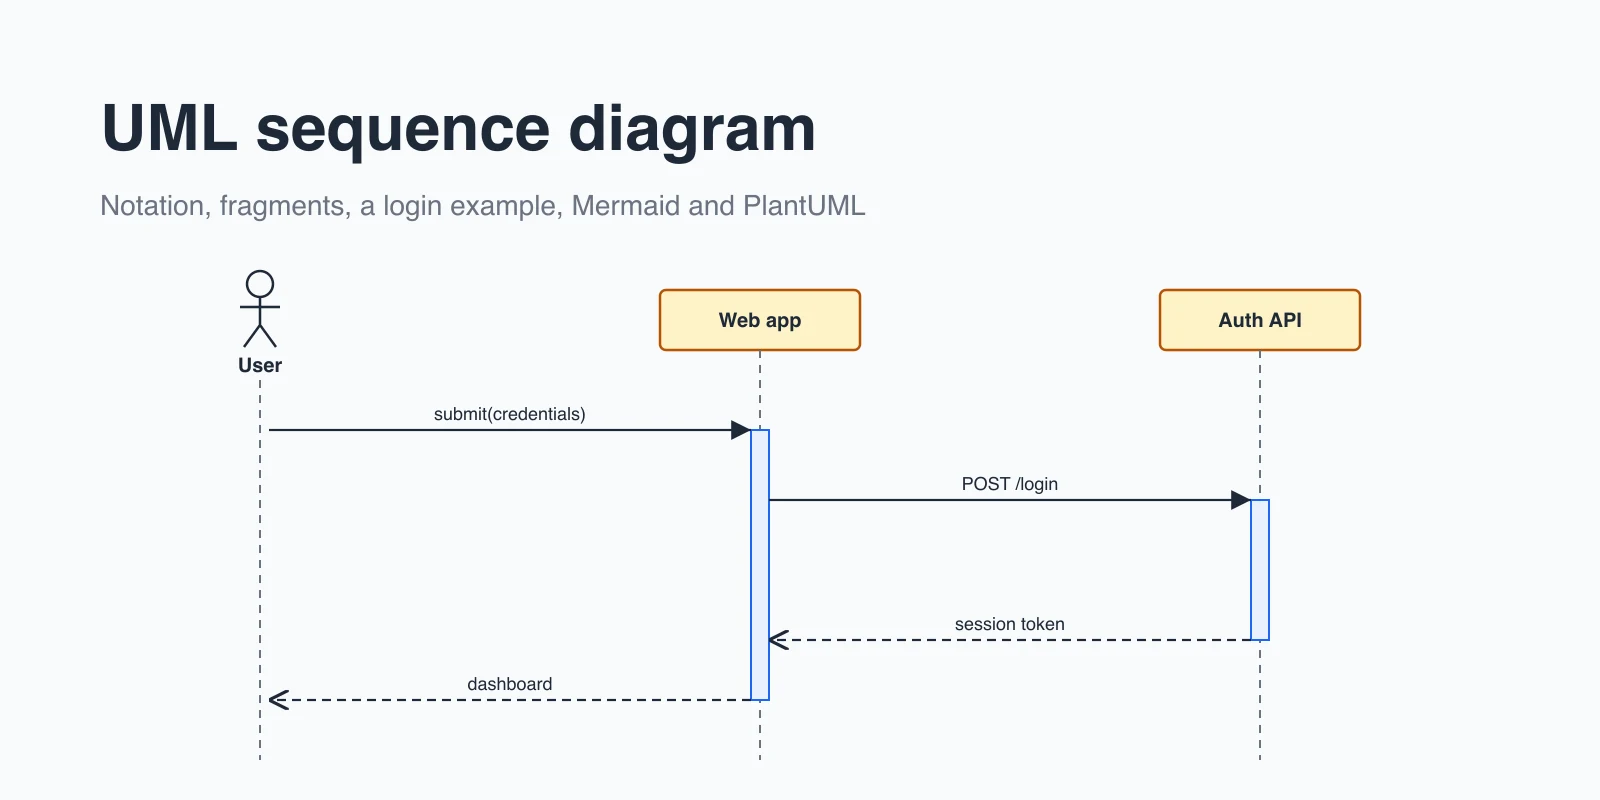
| Sequence or dynamic | In what order do parts interact for one scenario, such as checkout? | Developers, reviewers | One use case, step by step |
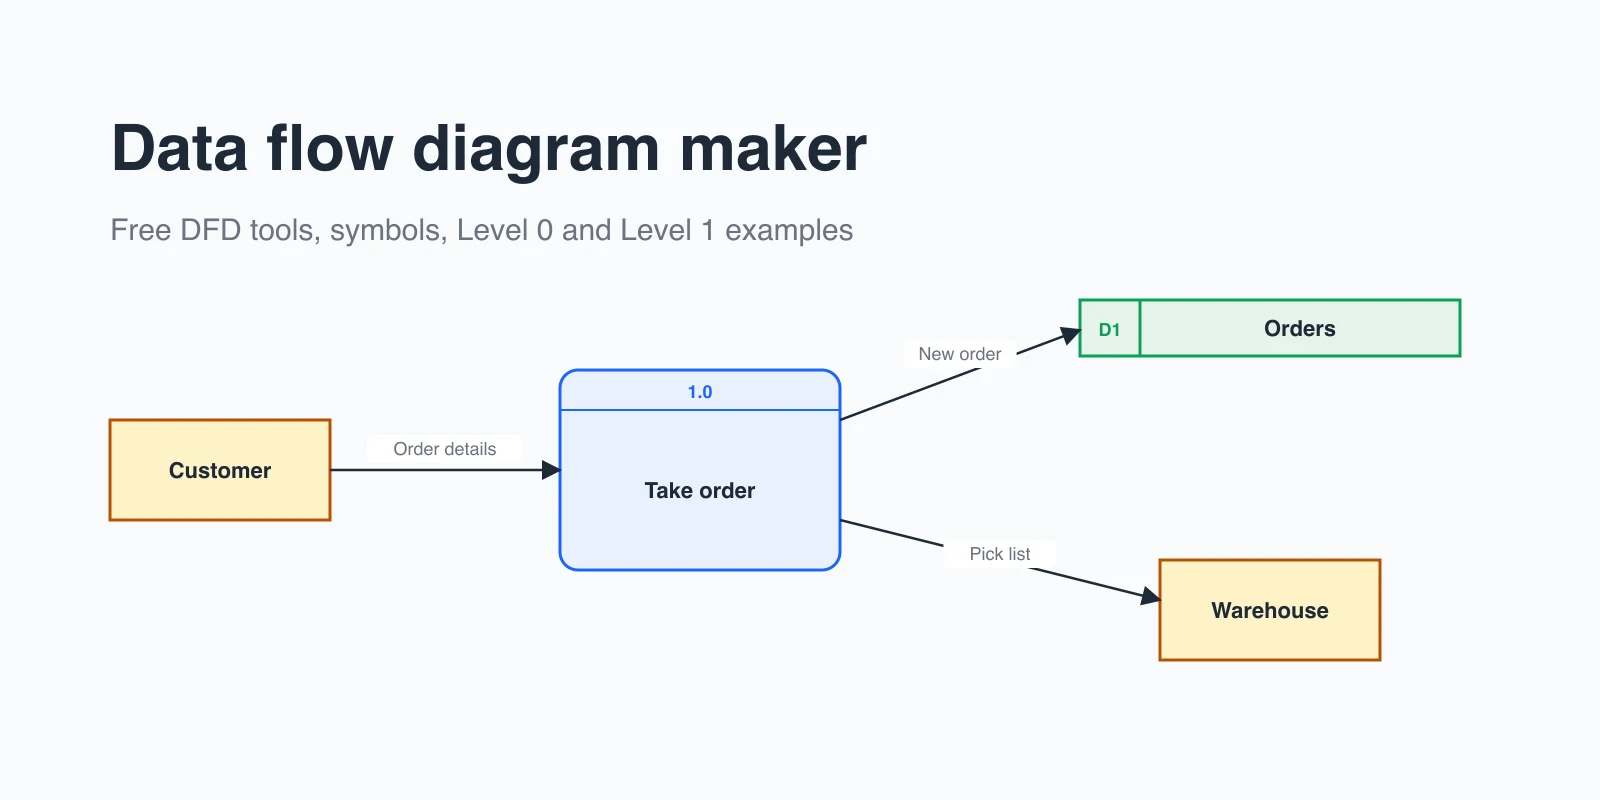
| Data flow | Where does data come from, where is it stored, and where does it go? | Security, privacy, compliance | Data stores, processes, trust boundaries |
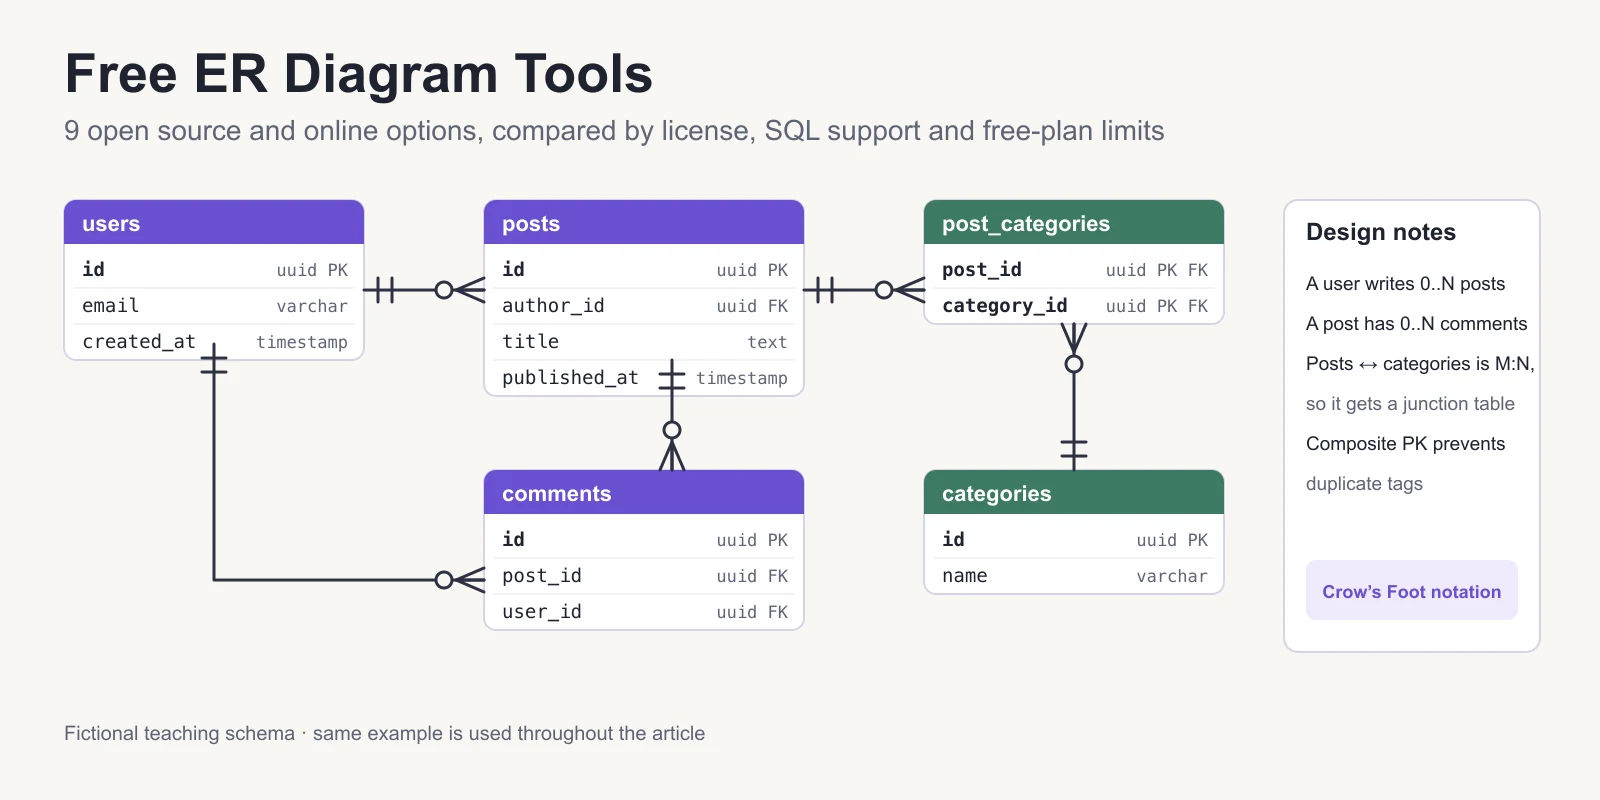
| Code (class, ER) | How is one component implemented? | Developers | Classes, interfaces, tables |
For a deeper look at the first level, see our guide to the system context diagram. For scenario-level diagrams, see the UML sequence diagram guide, and for database structure, our ER diagram tool guide.
The C4 model in brief
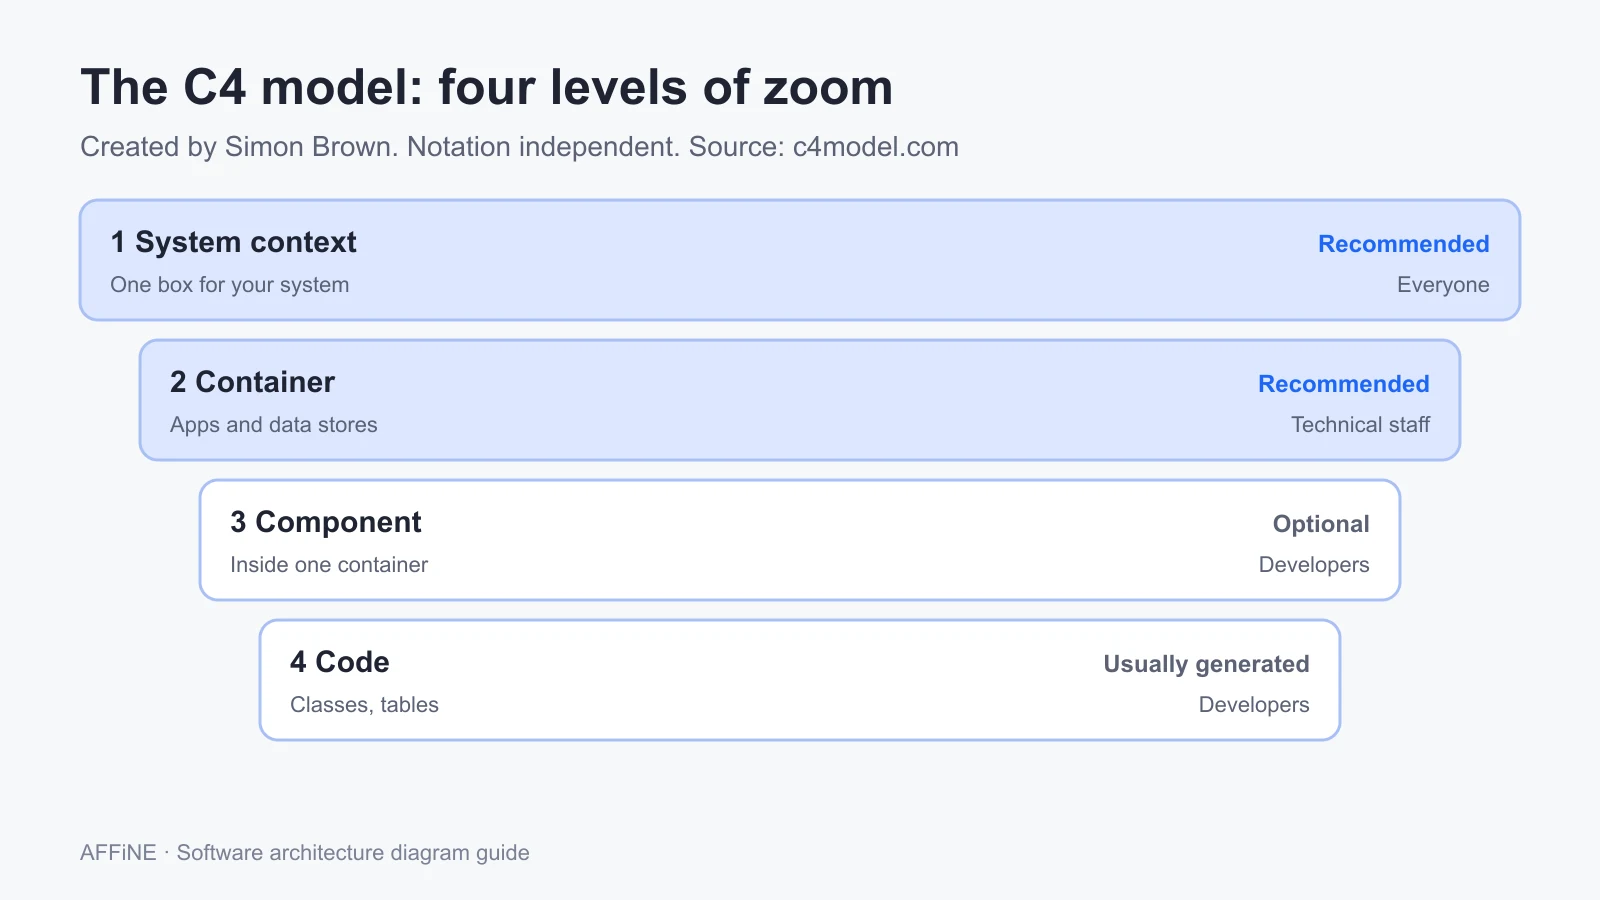
The C4 model is a lightweight approach to software architecture diagramming created by Simon Brown. According to the official site, its roots go back to around 2006 to 2009, the diagram types were named in early 2010, and the "C4" name was first used in early 2011. It gives you four levels of zoom, a bit like a map that goes from country to street:
- System context. Your software system in the center, surrounded by the people who use it and the other software systems it interacts with. Recommended for all teams.
- Container. The applications and data stores inside the system boundary, such as a single-page web app, a mobile app, an API, a database, or a file store. Recommended for all teams.
- Component. The components inside one container. Optional: create these only if they add value, and consider generating them for long-lived documentation.
- Code. Classes, interfaces, or tables inside one component. Not recommended for long-lived documentation, because most IDEs can generate this level on demand.
C4 also describes three supporting diagrams: system landscape, dynamic, and deployment. Deployment diagrams matter in practice because the container diagram deliberately leaves out clustering, load balancers, and failover, which vary by environment.
Two details trip people up:
- A C4 "container" is not a Docker container. It is anything that must be running for the system to work: a server-side web application, a browser app, a mobile app, a database schema, or a storage bucket.
- C4 does not prescribe a notation. You can use plain boxes and arrows or UML. What it does ask for is clarity: a title stating diagram type and scope, a legend, an explicit type and short description on every element, a technology on every container, and labeled, one-way arrows.
Worked example: a container diagram for a shift-scheduling app
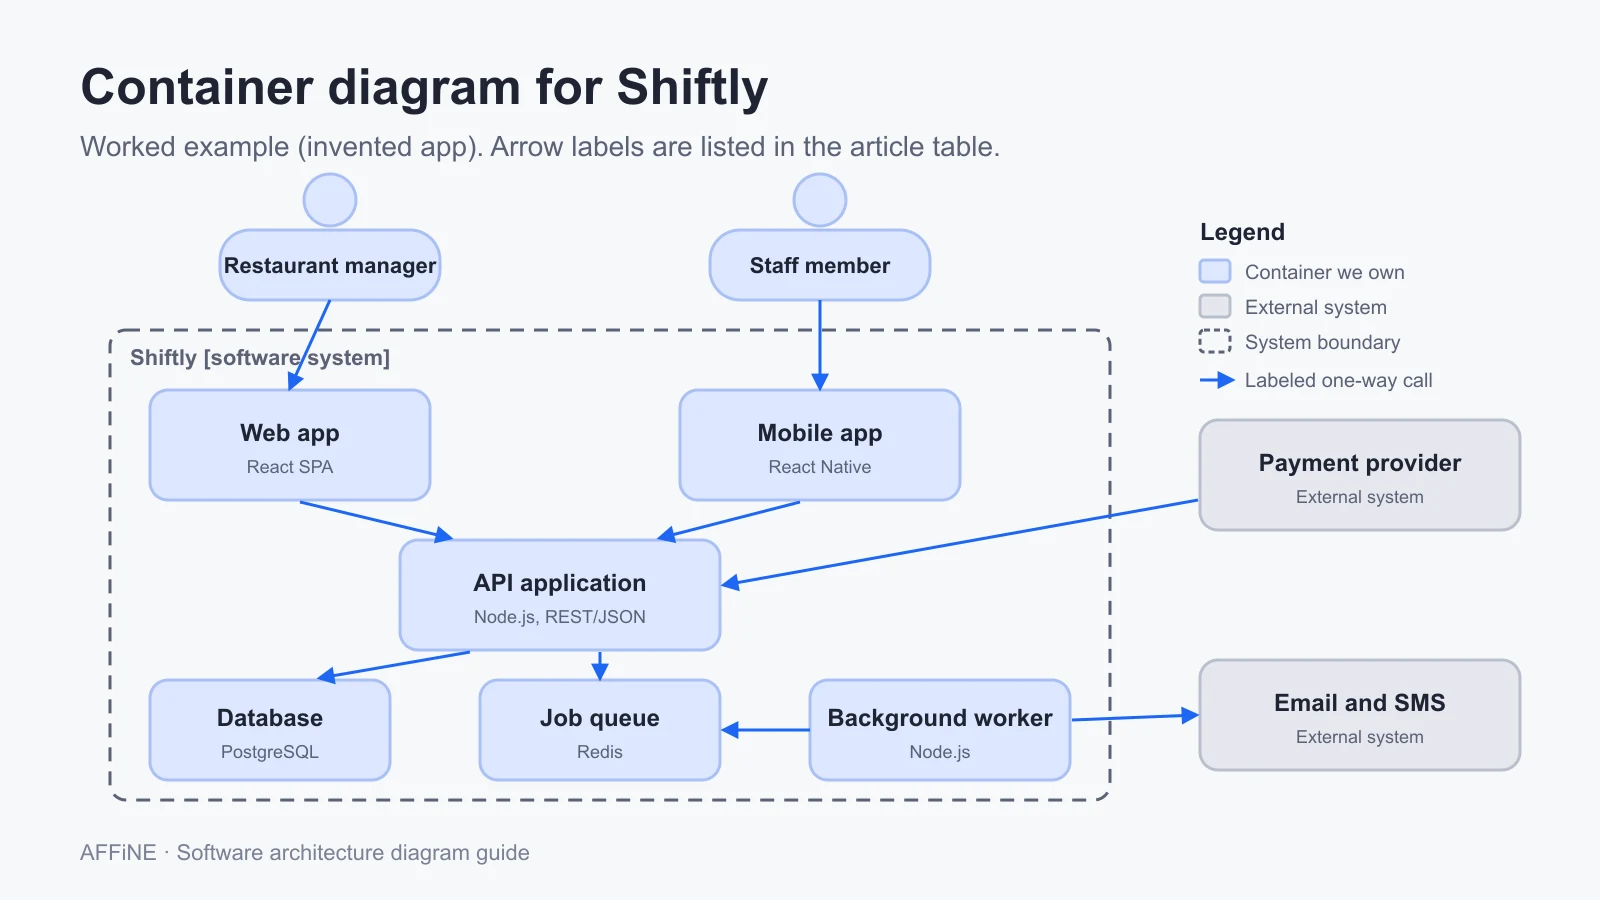
To make this concrete, here is a full container diagram for an invented product, Shiftly, a web and mobile app that restaurants use to schedule staff shifts. This is an illustrative example, not a real customer system, but the structure is typical of a small SaaS product.
Title: Container diagram for Shiftly
People
- Restaurant manager [Person]: creates schedules, approves shift swaps, and pays the subscription.
- Staff member [Person]: views shifts, requests swaps, and sets availability.
Containers inside the Shiftly boundary
- Web app [Container: React single-page app]: scheduling board for managers in the browser.
- Mobile app [Container: React Native]: shift list and swap requests for staff.
- API application [Container: Node.js, REST/JSON]: business rules for schedules, swaps, and accounts.
- Background worker [Container: Node.js]: sends reminders and processes billing events.
- Database [Container: PostgreSQL]: stores restaurants, staff, shifts, and swap requests.
- Job queue [Container: Redis]: holds reminder and billing jobs for the worker.
External systems
- Email and SMS provider [Software system, external]: delivers shift reminders.
- Payment provider [Software system, external]: charges subscriptions and sends billing webhooks.
Relationships (each arrow one direction, with intent and technology)
| From | To | Label |
|---|---|---|
| Restaurant manager | Web app | Builds weekly schedules [HTTPS] |
| Staff member | Mobile app | Views shifts, requests swaps [HTTPS] |
| Web app | API application | Makes API calls [REST/JSON, HTTPS] |
| Mobile app | API application | Makes API calls [REST/JSON, HTTPS] |
| API application | Database | Reads and writes schedules [SQL/TLS] |
| API application | Job queue | Enqueues reminder and billing jobs [Redis protocol] |
| Background worker | Job queue | Pulls jobs [Redis protocol] |
| Background worker | Email and SMS provider | Sends shift reminders [HTTPS API] |
| Payment provider | API application | Posts billing webhooks [HTTPS] |
A few decisions in this example are worth copying:
- The worker and queue are shown. A reviewer can see that reminders are asynchronous, so a slow SMS provider will not block the API.
- The webhook arrow points into the API. Direction shows who starts the conversation, which matters for firewall rules and retries.
- There is no load balancer or region. Those belong in a deployment diagram for production, which may differ from staging.
- The legend explains color and line style. Blue for containers you own, grey for external systems, dashed line for the system boundary.
How to draw a software architecture diagram
1. Choose the question and the audience
Write one sentence at the top of the canvas, such as "How do Shiftly's apps and data stores fit together, for new backend engineers?" If you cannot write it, you do not know which diagram to draw yet.
2. Pick the level of zoom
Use a system context diagram for scope and stakeholders, a container diagram for building blocks and technology, and a deployment diagram for infrastructure. Draw one level per diagram instead of mixing them.
3. List the elements before you draw
Write each person, container, and external system as a line of text with its name, type, technology, and a one-line responsibility. This list becomes the content of your boxes and catches missing pieces early.
4. Draw the boundary and place the boxes
Draw a dashed box for your system boundary. Put people at the top, your containers inside the boundary, and external systems outside it, usually to the right or bottom. Keep request flow running in one general direction.
5. Connect with labeled, one-way arrows
Draw one arrow per relationship and label it with intent and technology, such as "Reads and writes schedules [SQL/TLS]". Avoid two-headed arrows and single-word labels like "Uses".
6. Add a title and a legend, then review
Title the diagram with its type and scope, add a legend for colors, shapes, and line styles, and walk someone who did not draw it through the diagram. Every question they ask is a missing label.
Architecture diagram examples by situation
- New product pitch or roadmap review: a system context diagram only. Non-technical readers need scope, not technology.
- Onboarding a backend engineer: context plus container diagram, linked to the repository and the runbook.
- Security review: container diagram plus a data flow diagram with trust boundaries. Our data flow diagram guide covers that notation.
- Moving to the cloud or a new region: one deployment diagram per environment.
- Changing how code is built and released: a CI/CD pipeline diagram of the build, test and deploy stages.
- Debugging a slow checkout: a sequence or dynamic diagram for that one scenario.
- Splitting a monolith: a component diagram of the monolith today and a container diagram of the target, side by side.
Common mistakes
- One giant diagram. Mixing users, services, classes, and servers in a single view makes it unreadable. Split by level.
- Unlabeled arrows. An arrow without a label could mean a call, a data copy, or a dependency. Readers will guess differently.
- Two-headed arrows. They hide who initiates a request. Draw two arrows if traffic really goes both ways.
- No legend. Colors and dashed lines mean something to the author only.
- Missing technology. "Database" is not enough; "PostgreSQL" tells an operations engineer what to monitor.
- Diagrams that never change. Store the diagram next to the design doc or decision record it explains, and update it in the same change that alters the architecture.
Use the template
Copy this outline into a doc or whiteboard and replace the example values. It follows the C4 container level and fits on one screen. You can also open the editable software architecture diagram template in AFFiNE, which has the same layout, the Shiftly example, and a legend on an Edgeless whiteboard.
Title: Container diagram for <System name>
Question: <What this diagram explains, and for whom>
Last updated: <YYYY-MM-DD>   Owner: <name or team>

PEOPLE (top row)
- <Role 1> [Person]: <what they do with the system>
- <Role 2> [Person]: <what they do with the system>

SYSTEM BOUNDARY: <System name> (dashed box)
- <Web app> [Container: <technology>]: <responsibility>
- <Mobile app> [Container: <technology>]: <responsibility>
- <API application> [Container: <technology>]: <responsibility>
- <Background worker> [Container: <technology>]: <responsibility>
- <Database> [Container: <technology>]: <what it stores>

EXTERNAL SYSTEMS (outside the boundary)
- <External system 1> [Software system]: <what it provides>
- <External system 2> [Software system]: <what it provides>

RELATIONSHIPS (one direction each: from -> to : intent [technology])
- <Role 1> -> <Web app> : <intent> [HTTPS]
- <Web app> -> <API application> : <intent> [REST/JSON, HTTPS]
- <API application> -> <Database> : <intent> [SQL/TLS]
- <Background worker> -> <External system 1> : <intent> [HTTPS API]

LEGEND
- Blue box: container we own
- Grey box: external software system
- Person shape: user role
- Dashed box: system boundary
- Solid arrow: request or data flow, labeled with intent and technology

REVIEW CHECKLIST
- [ ] Title states diagram type and scope
- [ ] Every element has a name, type, and one-line description
- [ ] Every container names its technology
- [ ] Every arrow is one-way and labeled with intent and technology
- [ ] Legend explains colors, shapes, and line styles
Drawing architecture diagrams in AFFiNE
AFFiNE is a workspace where every doc has two modes: Page mode, a linear document, and Edgeless mode, an open canvas for shapes, connectors, frames, and notes. That combination suits architecture diagrams because the written design and the picture can live in the same doc. You can put the container diagram in a frame on the canvas and keep the element list, decisions, and open questions as text next to it, then link that doc from your other pages (how page linking works). The component diagram template and deployment diagram template cover the next levels down, and more are in the diagram template collection.
AFFiNE runs as a cloud service or self-hosted. Self-hosting is free for up to 10 seats per workspace; larger teams need a paid plan or license. See self-hosting and pricing for current terms.
Who should not use AFFiNE for this:
- Teams that want diagrams generated from code or a text model, such as Structurizr DSL, PlantUML, or Mermaid in a repository. AFFiNE is a drawing canvas, not a modeling tool, so it will not keep several C4 views in sync from one model.
- Teams that need large official cloud icon libraries for AWS, Azure, or Google Cloud deployment diagrams. Dedicated diagramming tools ship these sets.
- Teams that must keep diagrams in version control next to the code for review in pull requests. Diagrams-as-code tools fit that workflow better.
FAQ
What should a software architecture diagram include?
At minimum: a title with the diagram type and scope, the people and external systems involved, the main building blocks with their technology, one-way arrows labeled with what flows and how, and a legend that explains colors, shapes, and line styles.
What is the C4 model?
The C4 model is an approach to software architecture diagramming created by Simon Brown. It describes four levels of zoom: system context, container, component, and code. It is notation independent and tooling independent, and its official site recommends system context and container diagrams for all teams.
What is the difference between a system context diagram and a container diagram?
A system context diagram shows your system as one box with its users and the other systems it depends on. A container diagram zooms into that box and shows the applications and data stores inside it, such as a web app, an API, and a database, with the technologies and protocols between them.
Is UML required for software architecture diagrams?
No. UML component and deployment diagrams work well, but many teams use simple boxes and arrows. What matters is that the notation is explained in a legend and that every element and arrow is labeled.
How many architecture diagrams does a project need?
Most teams need a system context diagram and a container diagram, plus a deployment diagram per environment if infrastructure matters. Add component, sequence, or data flow diagrams only when a specific question or review needs them.
Sources and editorial notes
- C4 model, home page, FAQ, System context diagram, Container diagram, Component diagram, Code diagram, Container abstraction, Notation, and Review checklist, by Simon Brown. Accessed October 28, 2026.
- AFFiNE Docs, Page mode and Frames and groups, plus self-host documentation. Accessed October 28, 2026.
- SERP review of the top results for "software architecture diagram" (Miro, AWS, Mural, Excalidraw, GeeksforGeeks, vFunction, and others) on October 28, 2026, used to identify gaps rather than as factual sources.
How this guide was prepared: AFFiNE wrote this article in October 2026. The diagram-type table, the Shiftly example, and the template reflect common architecture documentation practice and the published C4 guidance; Shiftly is invented and is not a customer case. AFFiNE sells a whiteboard and docs product, so we have a commercial interest in diagramming; the "who should not use AFFiNE" list is there to keep that honest. AI tools assisted with research and drafting, and the AFFiNE team reviewed and edited the content.