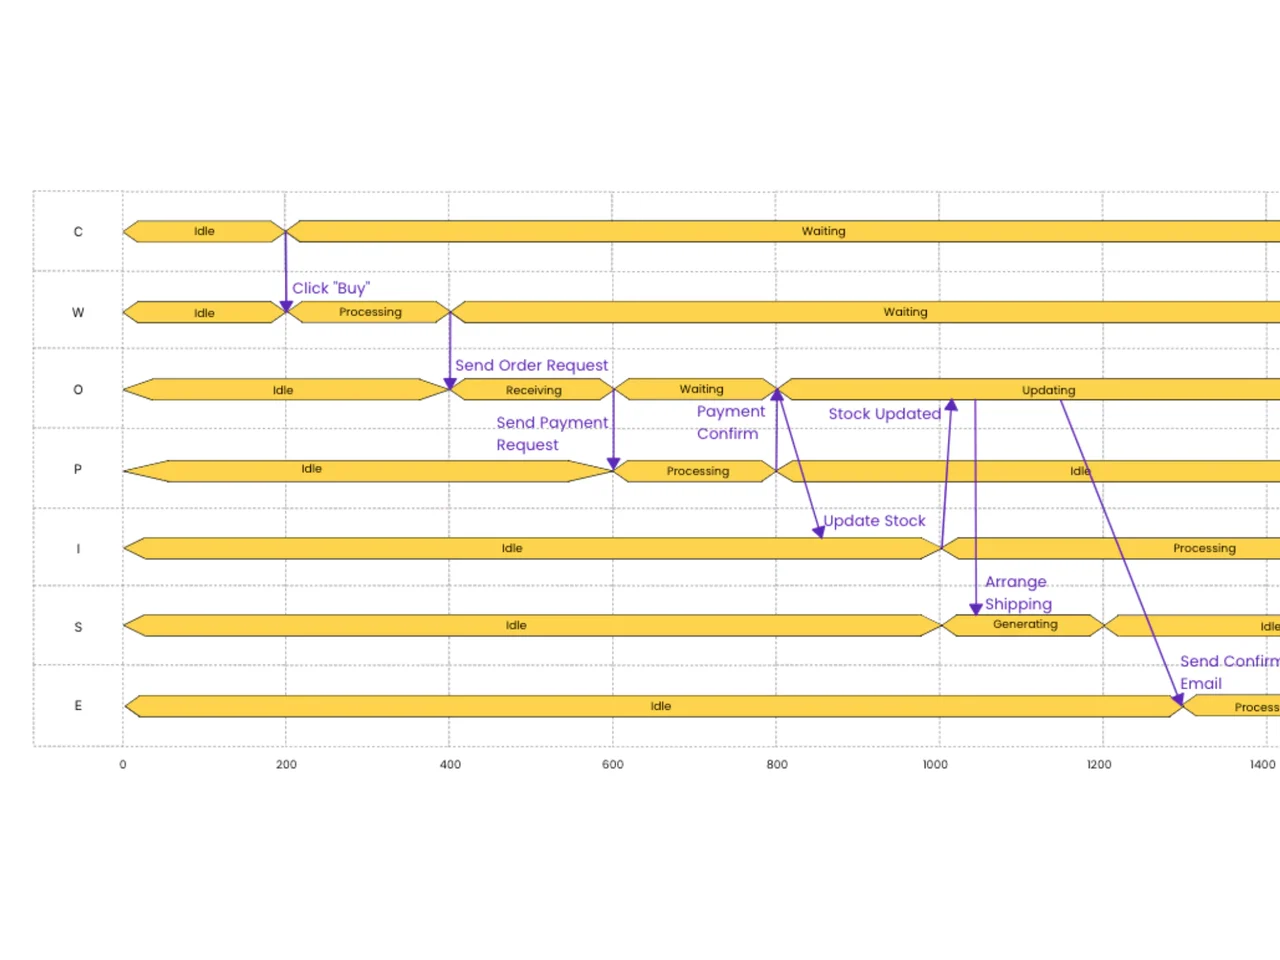
Timing Diagram

Free timing diagram template for the AFFiNE whiteboard: seven lifelines, state bars, and event arrows on a time axis, using an online order flow as the example.

Timing diagram with seven lifelines showing Idle, Processing, and Waiting states and message arrows along a 0 to 1400 time axis

A timing diagram template is a ready-made chart that shows how the states of several participants change along a shared time axis and how messages between them trigger those changes. This AFFiNE template opens on the whiteboard with an online-order example: seven lifelines (C, W, O, P, I, S, E) moving between states such as Idle, Processing, Receiving, Waiting, Updating, and Generating on a 0 to 1400 time scale, with arrows for events like Click "Buy," Send Order Request, Send Payment Request, Update Stock, Arrange Shipping, and Send Confirm Email.

What's included in this template

  • A grid with a numbered horizontal time axis (0 to 1400) and dashed guide lines
  • Seven labeled lifeline rows, one per participant
  • State bars showing when each participant is Idle, Processing, Waiting, Receiving, Updating, or Generating
  • Purple message arrows that link an event on one lifeline to the state change it causes on another
  • Editable text, shapes, and connectors on an infinite canvas

The letters in the sample appear to stand for an e-commerce flow (customer, website, order, payment, inventory, shipping, email). Rename them to match your system.

When to use a timing diagram

  • Software and API flows. Show how long each service waits or processes during a request, and where calls overlap.
  • Embedded and hardware design. Document signal or state changes of components against a clock or time scale.
  • UML modeling. A timing diagram is one of the UML interaction diagrams, useful when exact timing matters more than message order alone.
  • Performance reviews. Spot long Waiting periods and idle participants that point to bottlenecks.

How to use this timing diagram template in AFFiNE

  1. Duplicate the template. Click Use this template to copy the board into your workspace.
  2. Define the lifelines. Rename the row labels to the components, services, or signals you are modeling, and add or delete rows.
  3. Set the time scale. Edit the axis numbers to your unit, such as milliseconds or clock cycles.
  4. Draw the states. Resize and relabel the state bars so each one starts and ends at the right time.
  5. Connect the events. Move the message arrows so each points from the triggering event to the state change it causes.
  6. Annotate and share. Add notes on constraints or delays, then share the board or export it to PNG or PDF.

Frequently asked questions

What is a timing diagram used for?

A timing diagram shows how objects or signals change state over time and how they interact. Teams use it to analyze real-time behavior, check timing constraints, and document system sequences.

What is the difference between a timing diagram and a sequence diagram?

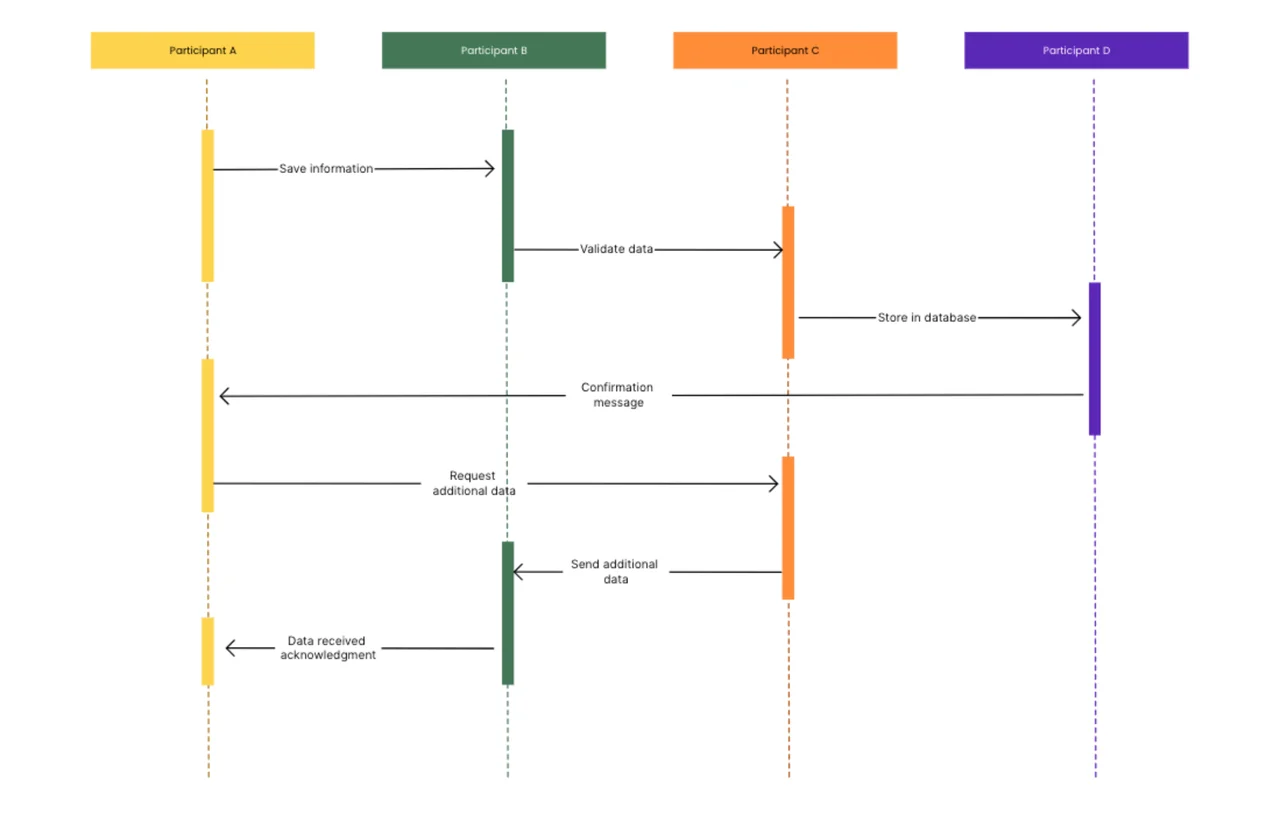
A sequence diagram focuses on the order of messages between participants. A timing diagram adds an explicit time axis and shows each participant's state over that time, so durations and overlaps are visible.

Is a timing diagram part of UML?

Yes. UML 2 includes the timing diagram as one of its interaction diagrams, alongside sequence, communication, and interaction overview diagrams.

Can I use this template for digital signal waveforms?

Yes. Treat each lifeline as a signal, use the time axis for clock cycles, and relabel the state bars as high, low, or bus values.

See also the sequence diagram template, the state diagram template, all diagram templates, and our technical documentation guide.

Get more things done, your creativity isn't monotone